
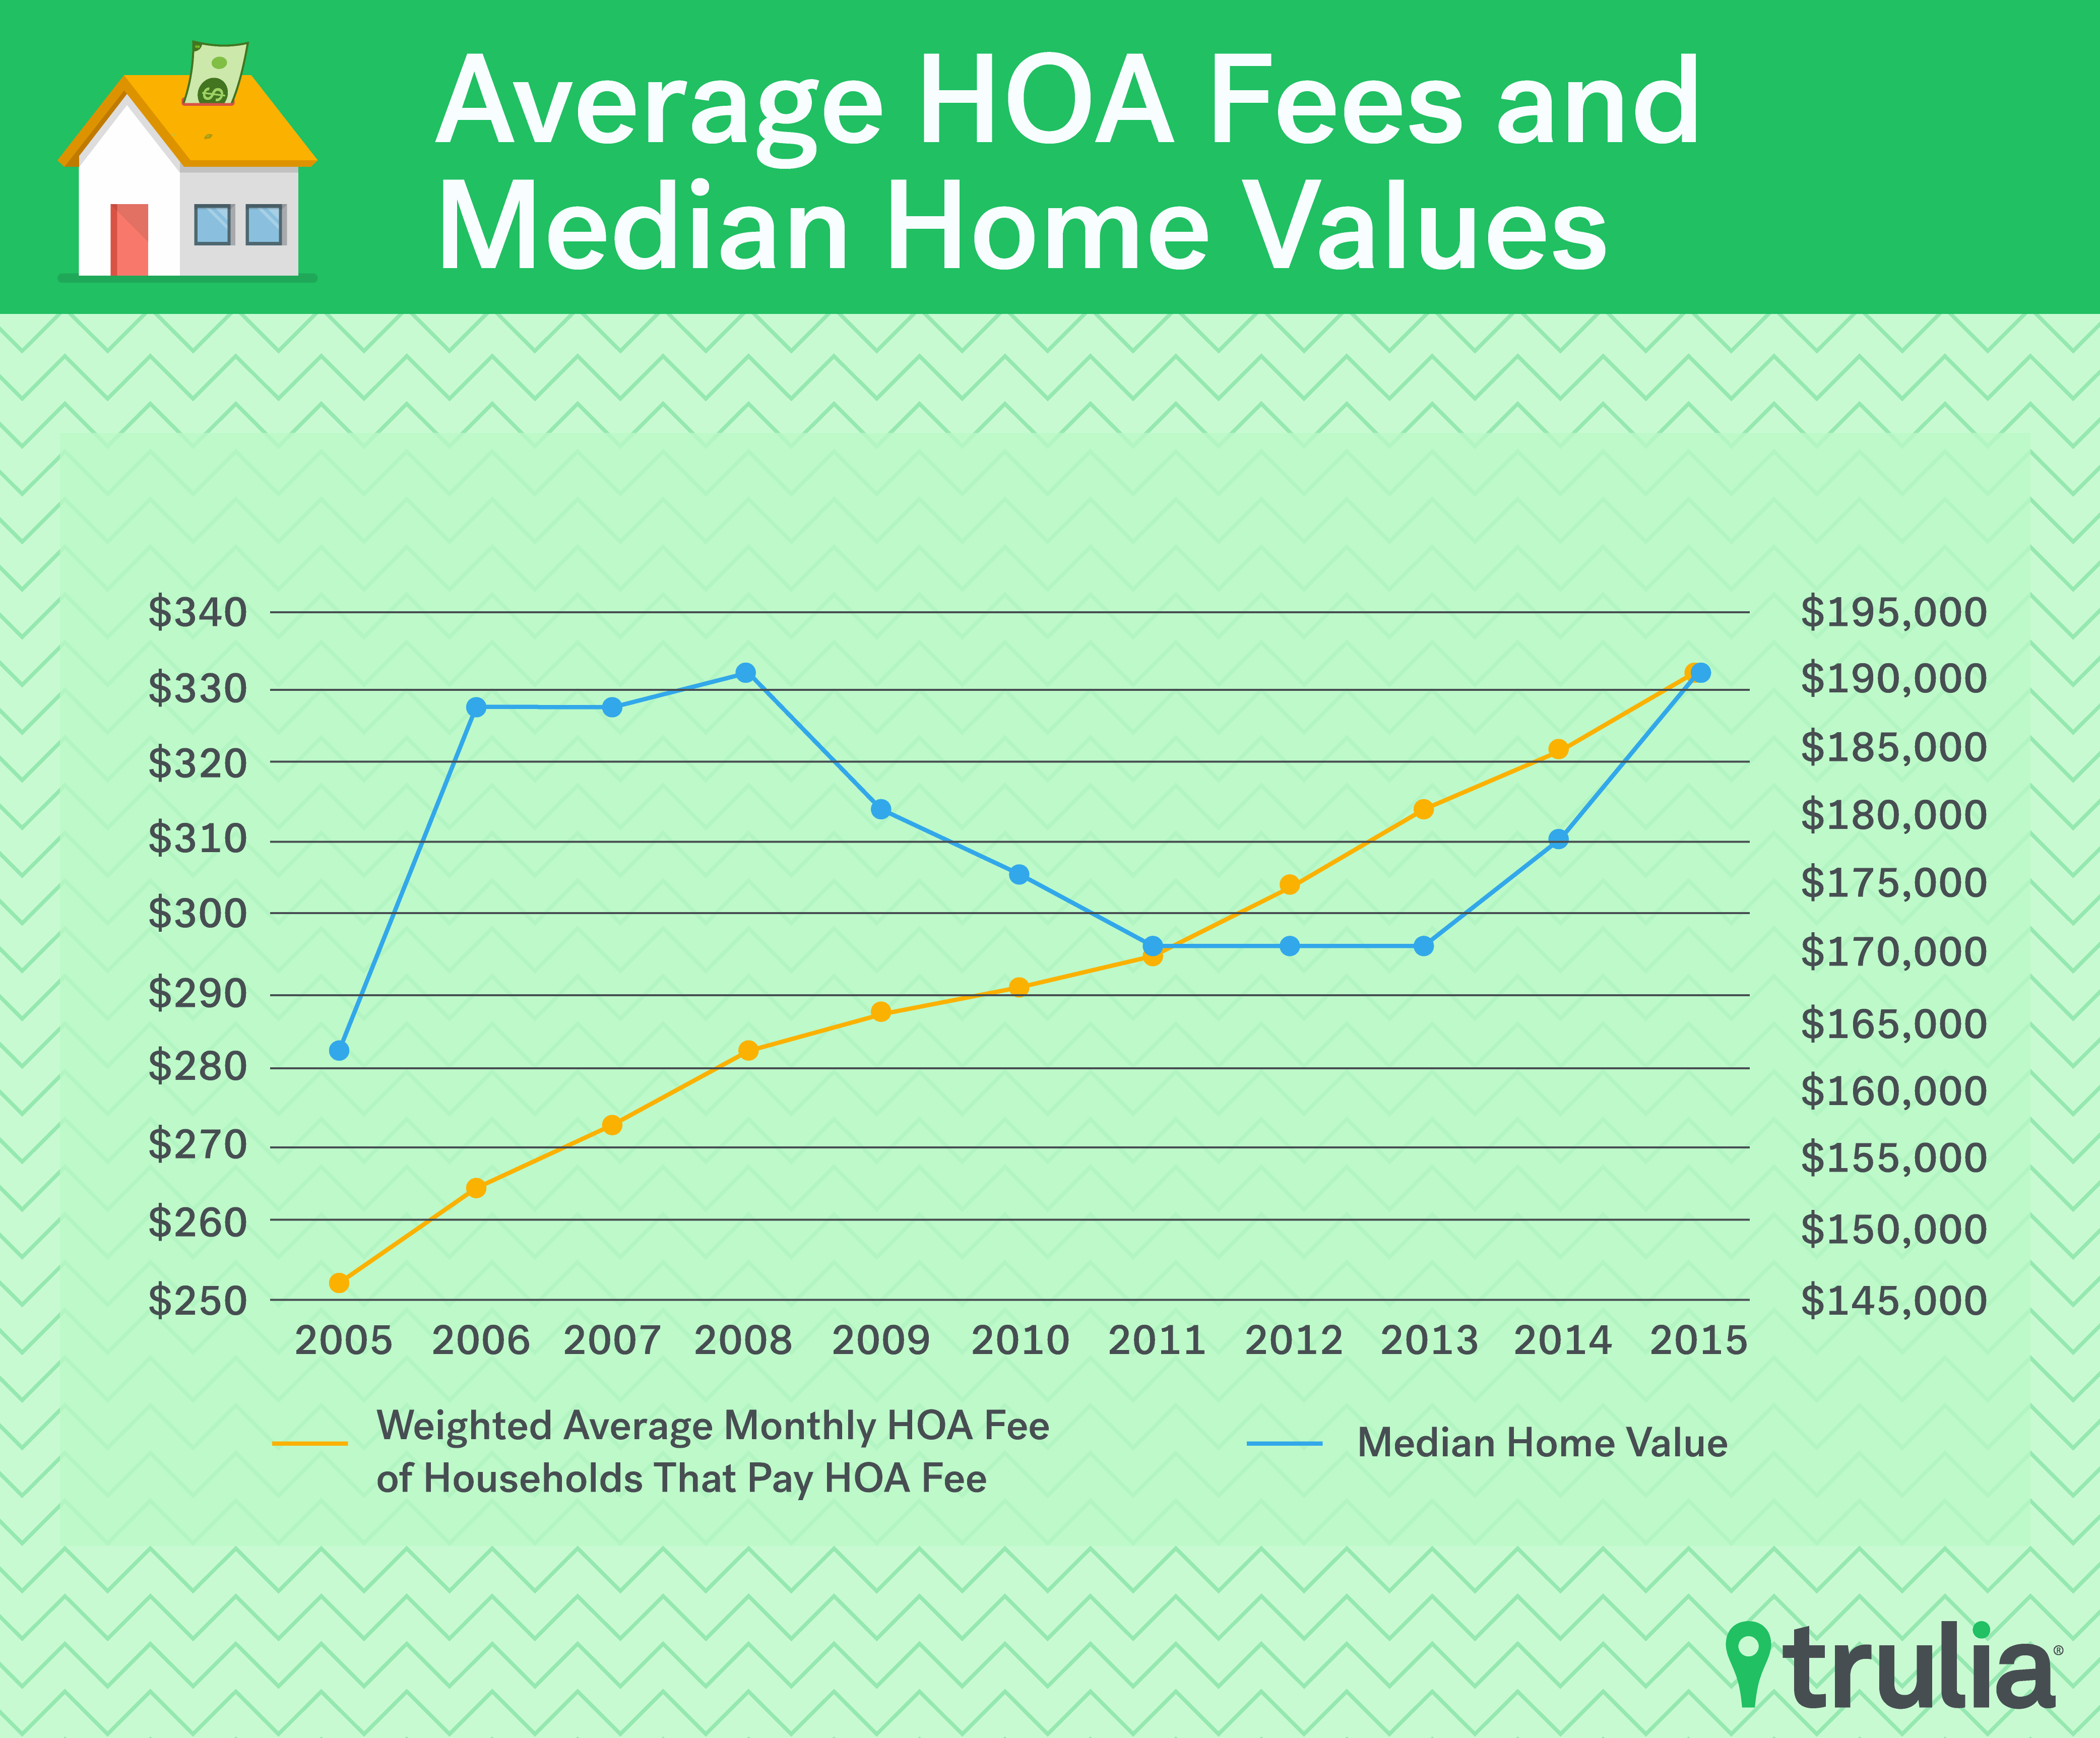
Homeowners association fees have been on the rise throughout the country. In 2005, the average monthly HOA fee among all households in the country stood at $250. By 2015, the average fee was $331, a pace that’s not only outpaced the nation’s housing prices, but exceeded the inflation rate by 5.9%.
For the uninitiated, homeowners association fees are required monthly fees that help cover the cost of maintaining a community’s common spaces such as a gym, pool or activity room, landscaping or even utilities and cable TV. They are usually, but not necessarily, attached to homes that are a unit in a multi-family building, such as a HOA or townhouse, but can included single family homes in a community too.
The financial crisis and great recession of 2008-2009 did little to halt the inexorable march of HOA fees (green) despite the drop in home prices (orange). They continued to rise. Trulia sought to identify what kind of properties are likely to have high HOA, or homeowners association fees, what markets had the highest fees and what caused HOA fees to rise so steadily.
Examining U.S. Census data at the household level, we found:
- HOA Fee Increases Outpaced Home Prices: Between 2005 and 2015 HOA and HOA fees rose 32.4% compared to just 15.1% for the median U.S. home.
- HOA Fees Are Higher in Older Buildings: The later the building was constructed, the smaller the HOA fee. Compared to HOA fees paid by households in buildings that were constructed in 1939 or earlier. For instance, HOA fees paid by households in buildings constructed in 2005 or later were $90 amonth cheaper than household in homes built between 1960 and 1969.
- Fewer Units Equal Lower/HOA Fees: The fewer units in the building, the smaller the HOA fee. Compared to single family detached homes within a development that requires HOA fees units in buildings with 20 to 49 units had HOA fees that were $160 a month higher. Units in buildings with 50+ units had HOA fees that were $330 a month higher.
- The Smaller the Home the Smaller the HOA Fee: The fewer bedrooms in the unit, the smaller the HOA fees. An additional bedroom increases the HOA fee by roughly $30 a month.
- As a share of monthly housing costs; Tampa, Fla., (47.9%), Houston (42.6%), and Fort Lauderdale, Fla., (42%), have the highest HOA fees.
So what has caused HOA fees to rise so steadily in the past decade, even throughout the great recession? A big part of the answer is simple: homes are getting older. The average age of buildings occupied by homeowner households (36-years-old in 2005 and 41-years-old in 2015) was estimated using the same census data. Older buildings tend to require higher HOA fees, and the aging of the HOA housing stock may explain the steady increase in HOA fees even throughout the crisis.
To summarize, we found that HOA fees can be significantly higher in older buildings and in buildings that have many units. Also, HOA fees have been steadily on the rise all over the nation, even during the Great Recession, as the average U.S. residential building has gotten older.
Where HOA Fees Hurt the Most
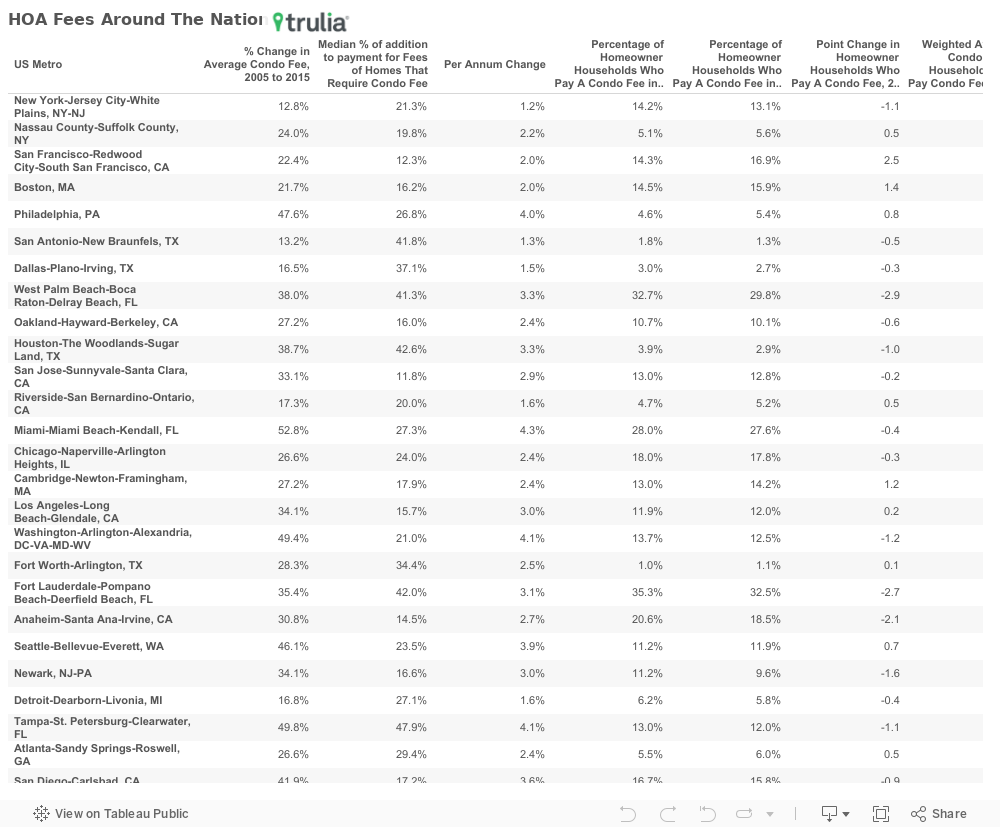
We also looked at the nation’s 50 largest metro areas by occupied housing units to see how HOA fees differ across each market.
New York came out on top when it comes to average HOA fee paid by households at $571 per month. New York was followed by Long Island ($498), San Francisco, ($463), Philadelphia ($449), and Miami, FL ($415). Metros with the cheapest HOA fees were Nashville, Tenn. ($194), Las Vegas, NV ($198), Indianapolis, IN ($213), Charlotte, N.C. ($218), and Warren, Mich., ($218).
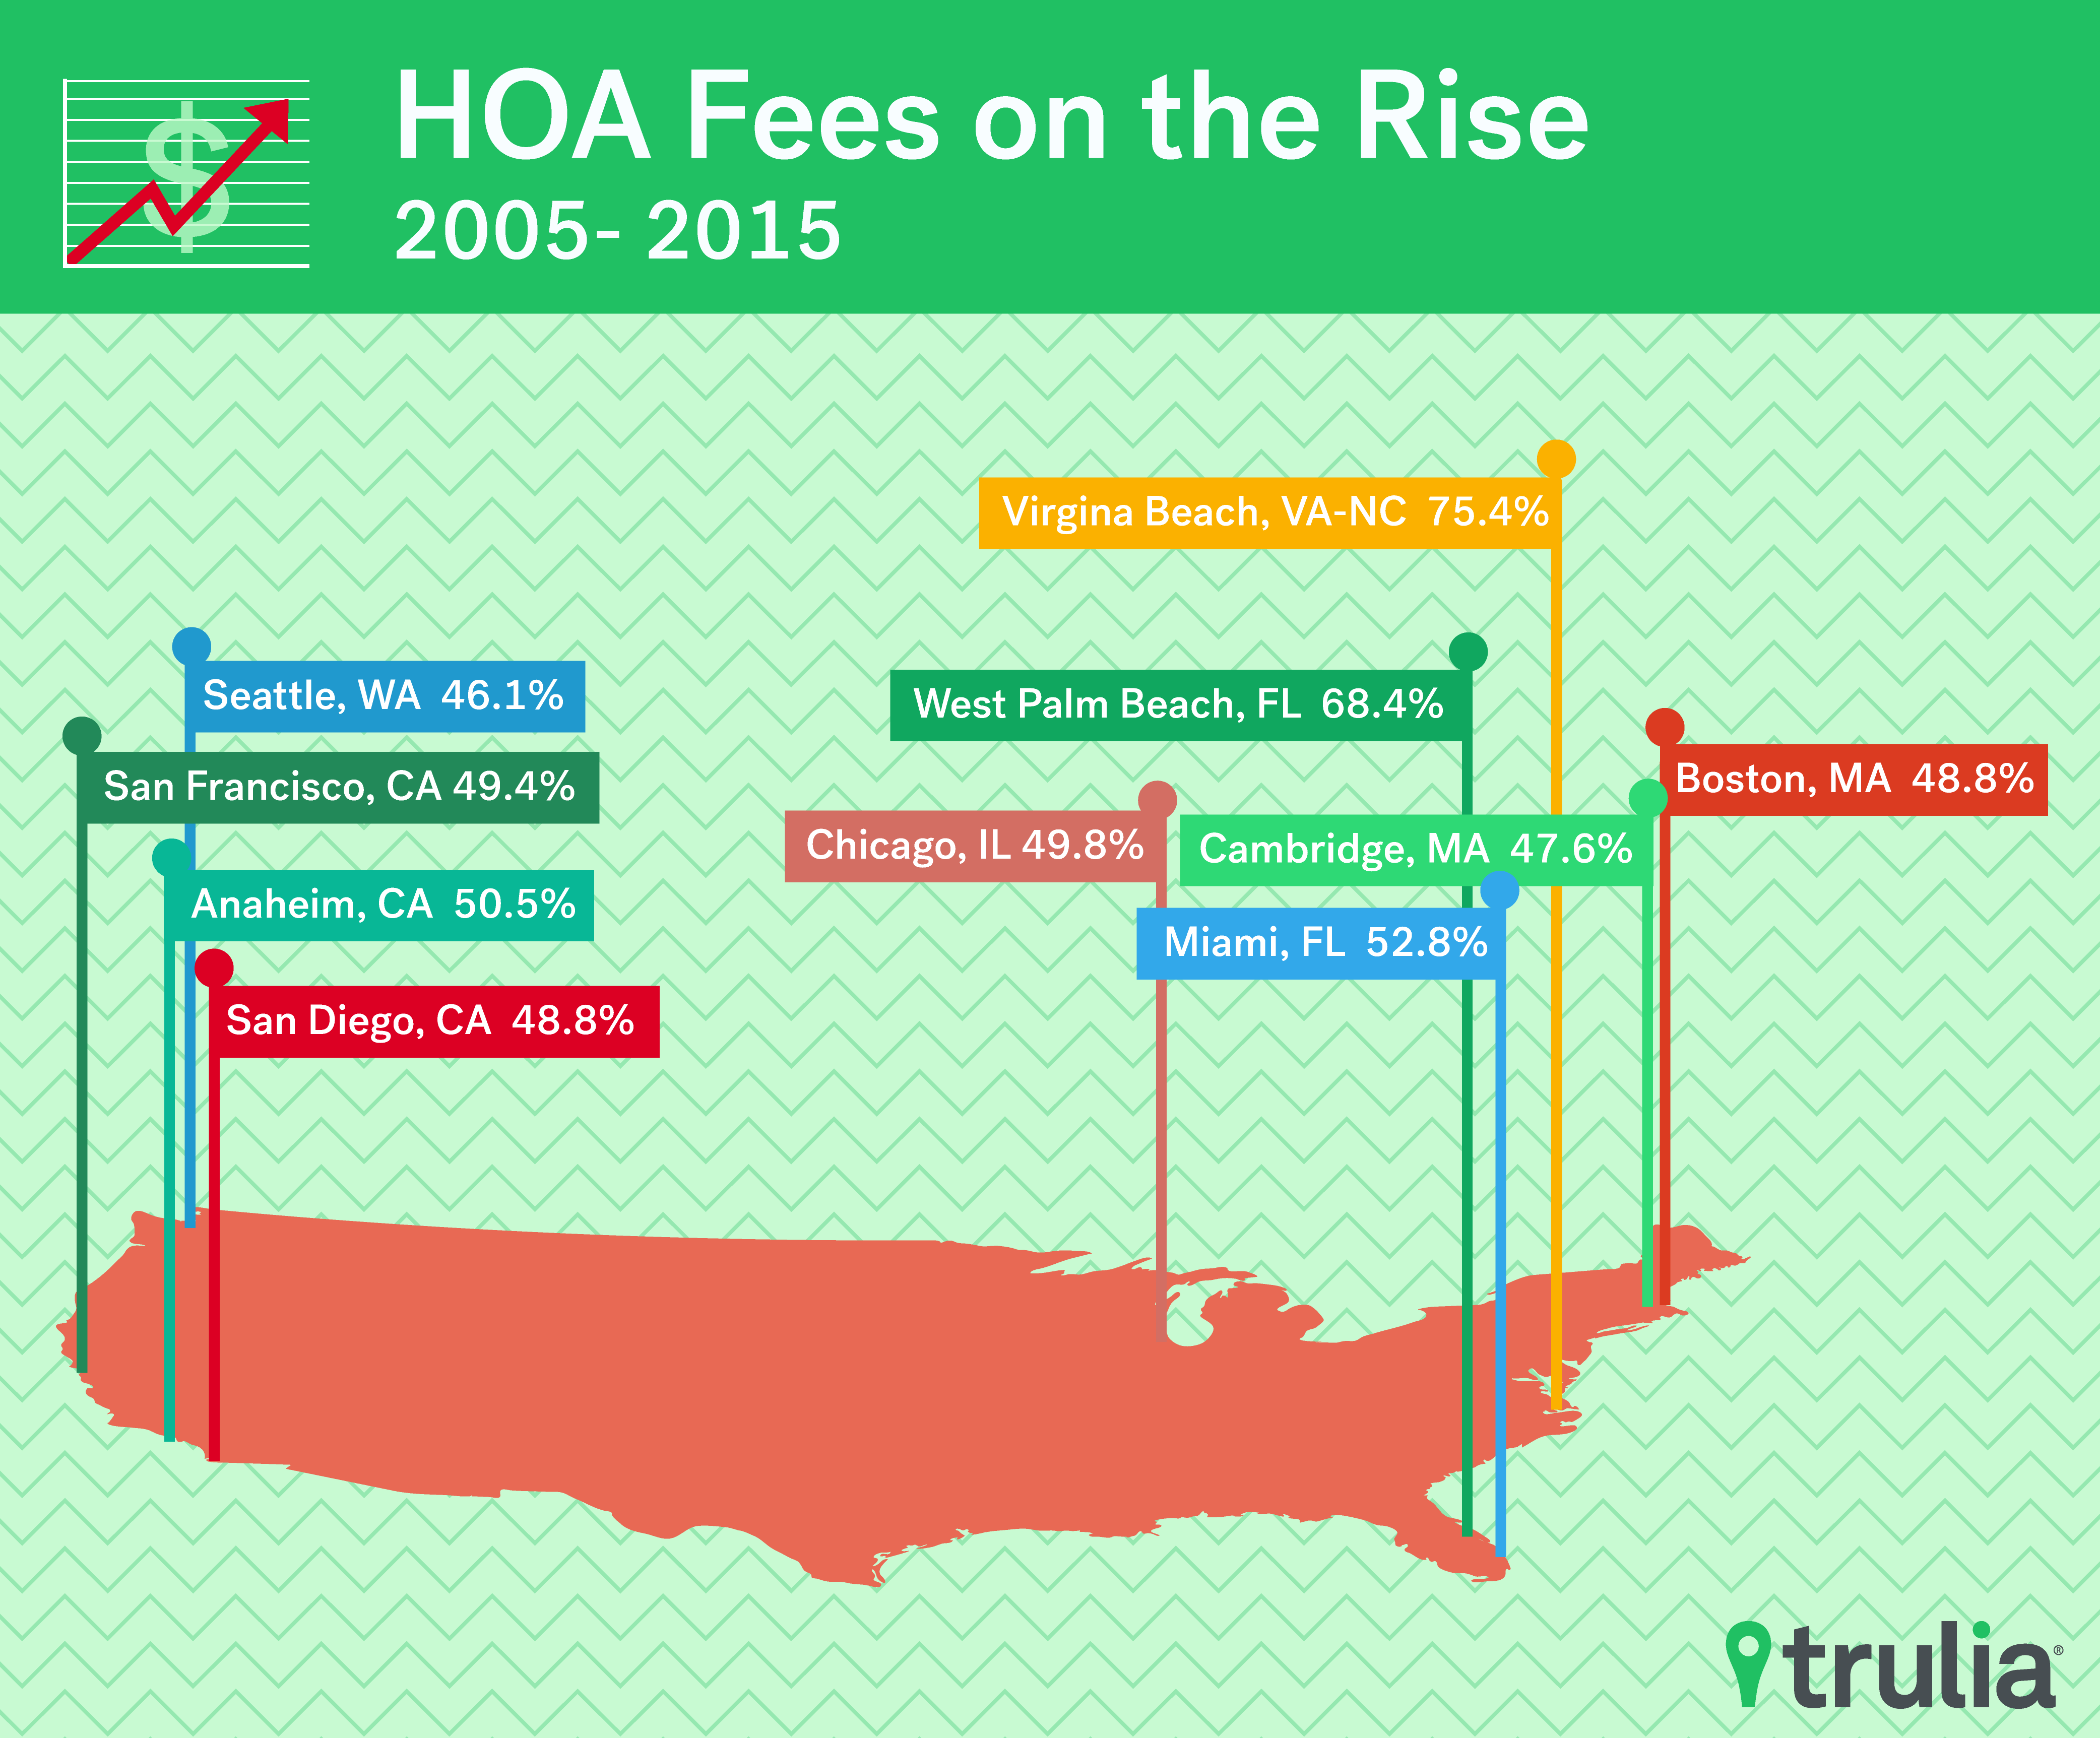
HOA fees increased the most between 2005 and 2015 in Virginia Beach, Va., (75.4%), Baltimore (68.4%), Miami, (52.8%), Providence, R.I., (50.5%) and Tampa, Fla., (49.8%). Markets at the bottom based on the change in average HOA fees from 2005 to 2015 were New York (12.8%), San Antonio, Texas, (13.2%), Austin, Texas (14.6%), Dallas (16.5%), and Detroit (16.8%).
As a share of monthly housing costs; Tampa, Fla., (47.9%), Houston (42.6%), and Fort Lauderdale, Fla., (42%), have the highest HOA fees. San Jose, Calif., (11.8%), San Francisco, (12.3%), Anaheim, Calif., (14.5%) had the smallest share.
When it comes to how commonplace HOA fees are, markets in Florida occupied the top. Metro areas with the highest percentage of homeowner households paying HOA fees are Fort Lauderdale, Fla., (32.5%); West Palm Beach, Fla., (29.8%); Miami, Fla., (27.6%); Orange County, Calif., (18.5%); and Chicago (17.8%). On the other hand, Texas markets dominated the bottom of this list, with Fort Worth, Texas, (1.1%); San Antonio, Texas, (1.3%); Kansas City, Mo., (2.0%); Dallas, TX (2.7%); and Houston (2.9%). These rankings are explained by the proportion of households that live in multifamily buildings in each of these metros.
| US Metro | Percentage of Homeowner Households Who Pay A HOA Fee in Metro Area, 2015 | Weighted Average HOA Fee of Households That Pay HOA Fee, 2015 | Percentage of Homeowner Households Who Pay A HOA Fee in Metro Area, 2005 | Weighted Average HOA Fee of Households That Pay HOA Fee, 2005 | Point Change in Homeowner Households Who Pay A HOA Fee, 2005 to 2015 | % Change in Average HOA Fee, 2005 to 2015 | Per Annum Change |
| New York-Jersey City-White Plains, NY-NJ | 13.1% | $571 | 14.2% | $506 | -1.1 | 12.8% | 1.2% |
| Nassau County-Suffolk County, NY | 5.6% | $498 | 5.1% | $401 | 0.5 | 24.0% | 2.2% |
| San Francisco-Redwood City-South San Francisco, CA | 16.9% | $463 | 14.3% | $378 | 2.5 | 22.4% | 2.0% |
| Philadelphia, PA | 5.4% | $449 | 4.6% | $304 | 0.8 | 47.6% | 4.0% |
| Miami-Miami Beach-Kendall, FL | 27.6% | $415 | 28.0% | $272 | -0.4 | 52.8% | 4.3% |
| West Palm Beach-Boca Raton-Delray Beach, FL | 29.8% | $399 | 32.7% | $289 | -2.9 | 38.0% | 3.3% |
| Boston, MA | 15.9% | $387 | 14.5% | $318 | 1.4 | 21.7% | 2.0% |
| Houston-The Woodlands-Sugar Land, TX | 2.9% | $387 | 3.9% | $279 | -1.0 | 38.7% | 3.3% |
| Washington-Arlington-Alexandria, DC-VA-MD-WV | 12.5% | $387 | 13.7% | $259 | -1.2 | 49.4% | 4.1% |
| San Jose-Sunnyvale-Santa Clara, CA | 12.8% | $367 | 13.0% | $276 | -0.2 | 33.1% | 2.9% |
Methodology
HOA fees often cover expenses related to operating, maintaining, and improving the HOA owners’ common property. This might include, but may not be limited to, city services – such as trash removal, water, and sewage –, building insurance, lawn care, pest control, and maintenance and repairs to outside the building. Each homeowners’ association has different policies, so buyers should always ask the seller for the building’s HOA rules. Depending on the rules of the HOA, one’s HOA fee might go up or down throughout one’s ownership of the HOA. The U.S. Census Bureau asks in its American Community Survey each year, “Is this house, apartment, or mobile home part of a HOA?”, and if so “What is the monthly HOA fee?” Residents can write a dollar amount as their answer. Using this data from the 1-Year 2005 through 2014 American Community Survey, we were able to answer questions we had surrounding HOA fees. We estimated the average approximate age of buildings lived in by homeowners by using the variable found in the IPUMS American Community Survey data. This is an approximate value that represents a range of years during which the building was built. We translated each response (the range of years) by picking the midpoint of the range. For the lowest range, which is defined as “1939 or earlier”, we assigned a value of 1920. We then used these midpoints (a particular year) in deriving the rough age of the building for each household record. Then based on this age of the building for each household record, we calculated the weighted average age of buildings lived in by homeowner households. Metro area definitions follow metropolitan divisions where available first, then metropolitan statistical areas. Metro by metro comparison analysis was limited to the 50 largest metro areas by occupied household. For the weighted ordinary least square regression, we used the same 1-year ACS data to minimize the following:, where each record (which only included head-of-household homeowner records that paid a HOA fee and had a non-NA home value) was weighted (wi) using the associated household weight. HOAFEE is a numeric variable that represents the dollar amount paid in HOA fees by household, BUILTYR2 is a categorical variable whose delineation roughly corresponds to the interval of years during which the property was built, UNITSSTR is a categorical variable whose delineation that corresponds to how many units are in the dwelling structure, MetroArea is a categorical variable that corresponds to which of the top 50 metro areas the household record belongs to, and finally BEDROOMS is a numeric variable that corresponds to the number of bedrooms in the household dwelling unit.

