Housing inventory remains tight, and one of the questions on the minds of many homebuyers this Spring is just how fast they will have to move to get the home they want and can afford.
To find out how long homes are staying on the market, we calculated the share of homes for sale on Trulia over a two-month period. We first looked at homes listed on February 5, then counted how many were still for sale on April 5. Faster-moving markets had a lower percentage of homes still on the market after two months, while slower-moving markets had a higher percentage.

Our two-month measure is similar to a common housing statistic: days on market (DOM). In general, housing markets with more inventory and fewer buyers will have a higher share of for-sale homes remaining on the market after two months and a higher median DOM. But we prefer our two-month measure over the widely watched DOM as a way to determine how quickly homes are moving in a market. Why? We think DOM is potentially misleading. If lots of new inventory suddenly lands on the market, then the median DOM could fall thanks to all those newly listed homes. Thus, a low median DOM might indicate that buyers are snapping up homes quickly, so homes aren’t staying on the market long (a seller’s market). But it could also signal that a lot of new inventory has just come onto the market (a buyer’s market). As a result, it’s difficult to decipher what’s really going on based on DOM alone.
Looking for a Bargain Home? So Is Everyone Else.
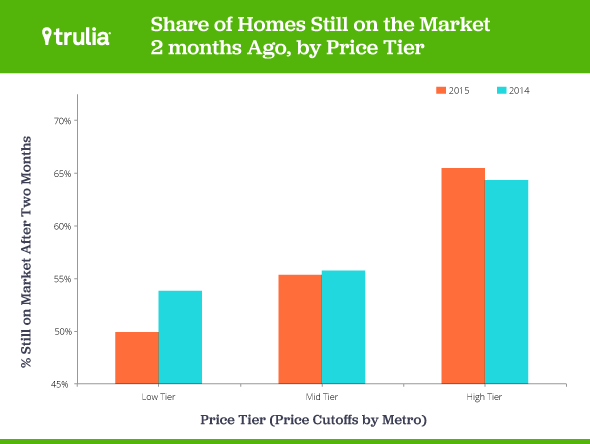
Nationally, 60% of homes listed for sale on February 5 were still on the market on April 5, down a bit from 62% for the same period last year. What’s quickening the pace of sales? It turns out it’s homes priced at the low end of the market. To see this, we evenly divided all homes in each of the 100 largest U.S. metros into three price tiers. We gave each metro its own price cutoffs based on what’s considered high-end, mid-range, and low-end locally. On average, lower-priced homes moved fastest. Only 50% of homes in this tier were still on the market after two months compared with 65% of higher-priced homes.
What’s more, home sales in the low-price tier sped up more compared with a year ago than sales in other tiers. The share of low-price homes still on the market after two months dropped 3 percentage points, compared with a 1 point drop for middle-tier homes and a 1 point increase for high-tier homes. As always though, the national trend hides big differences from one local market to another. In many metros, the sales pace is quickening, while in others it is slowing.

California: Home to America’s Fastest-Moving Housing Markets
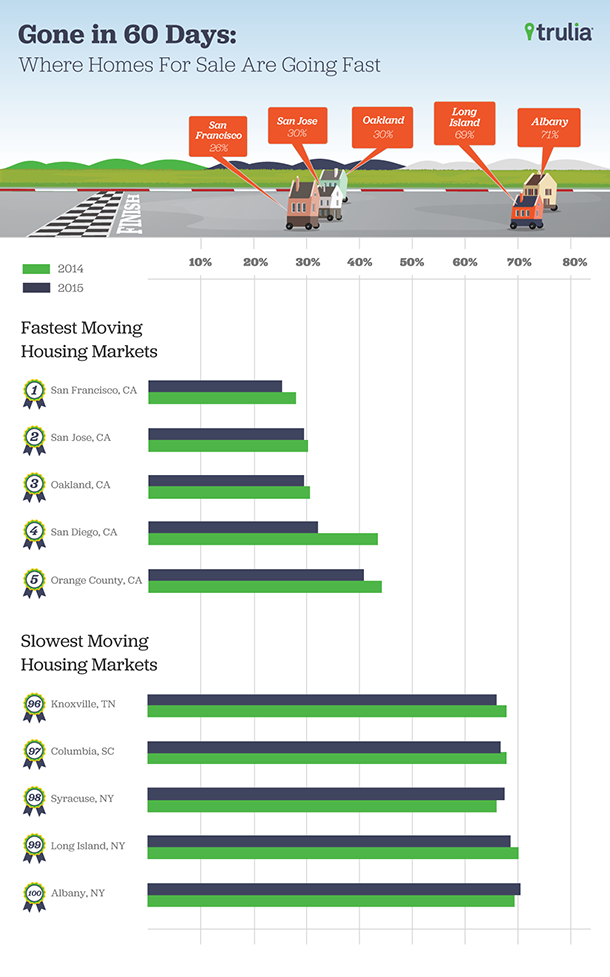
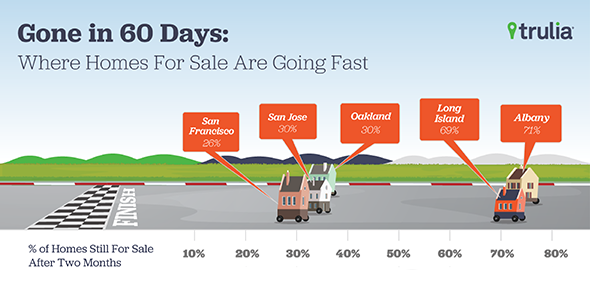
If you’re a home seller, California may indeed be the Golden State. Eight of the 10 fastest-moving housing markets are there, and homes are selling much faster than in the Northeast, South, and Midwest. In fact, fewer than 30% of homes for sale in the three San Francisco Bay Area metros remained on the market after two months. By contrast, about 70% of homes in Long Island and Albany, NY were still on the market. In addition, the only metros outside California that made the 10 fastest moving list were Seattle and Salt Lake City.
| America’s Top 10 Fastest-Moving Housing Markets | |||||
| # | U.S. Metro | % of homes still for sale after two months, April 2015 | % of homes still for sale after two months, April 2014 | Difference in share still for sale, 2015 vs 2014 | Median Asking Home prices, April 2015 |
| 1 | San Francisco, CA | 26% | 28% | -3% | $1,099,000 |
| 2 | San Jose, CA | 30% | 31% | -1% | $800,000 |
| 3 | Oakland, CA | 30% | 31% | -1% | $598,000 |
| 4 | San Diego, CA | 33% | 44% | -11% | $549,990 |
| 5 | Orange County, CA | 41% | 45% | -3% | $699,000 |
| 6 | Seattle, WA | 42% | 45% | -3% | $409,993 |
| 7 | Sacramento, CA | 42% | 45% | -3% | $396,950 |
| 8 | Los Angeles, CA | 43% | 45% | -3% | $549,000 |
| 9 | Ventura County, CA | 43% | 50% | -6% | $589,999 |
| 10 | Salt Lake City, UT | 45% | 28% | -6% | $299,900 |
| Note: Among the 100 largest U.S. metros. The two-month shares and the difference are rounded to the nearest percentage point, and the difference was calculated before rounding; therefore, the rounded difference might not equal the difference between the rounded shares. Click here to download the full results for each of the 100 largest U.S. metros. | |||||
None of the fastest-moving markets have slowed since last year. In fact, the markets on our top 10 list that sped up the most are San Diego, Ventura County, and Salt Lake City. Other markets that are speeding up most rapidly are almost exclusively in the South and Southwest. The share of homes for sale in Cape Coral–Fort Myers, FL still on the market two months later dropped from 64% in April 2014 to 47% in April 2015. El Paso, TX and Richmond, VA also sped up at a similar pace, even though homes in those markets aren’t moving quickly enough to land them on the 10 fastest-moving markets list.
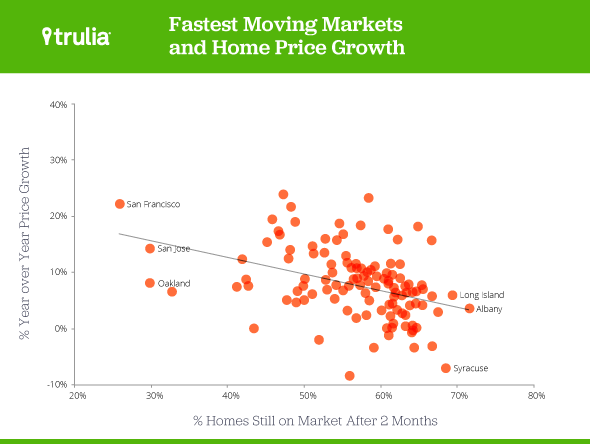
To illustrate this point, the figure below shows that homes in markets with bigger price increases tend to move faster, though not always. For the most part, these fast-moving metros are sellers’ markets where homes don’t sit very long.

Housing Markets Moving Sluggishly in Long Island and Albany, NY
In contrast, the slowest-moving markets are in the Northeast, including Long Island and Albany, and in the South, including Columbia, SC, and Knoxville. All but two of the 10 slowest-moving markets had year-over-year price increases below the 5% national average. However, even among these snail’s-pace markets, the share of homes still for sale after two months dropped in five of 10 metros. Knoxville and Long Island both all sped up 2 percentage points this year compared with last. It’s true that in six of the metros on this list, the pace of sales slowed in 2015 compared with the year before. The pace of sales slowed the most in Miami (9 points) and Pittsburgh (4 points)
| America’s Top 10 Slowest-Moving Housing Markets | |||||
| # | U.S. Metro | % of homes still for sale after two months, April 2015 | % of homes still for sale after two months, April 2014 | Difference in share still for sale, 2015 vs 2014 | Median Asking Home prices, April 2015 |
| 1 | Albany, NY | 71% | 70% | 1% | $264,900 |
| 2 | Long Island, NY | 69% | 71% | -2% | $474,995 |
| 3 | Syracuse, NY | 68% | 67% | 1% | $153,000 |
| 4 | Columbia, SC | 67% | 69% | -1% | $170,000 |
| 5 | Knoxville, TN | 67% | 69% | -2% | $184,900 |
| 6 | Pittsburgh, PA | 67% | 62% | 4% | $155,000 |
| 7 | Lake County –Kenosha County, IL-WI | 67% | 64% | 3% | $289,000 |
| 8 | Virginia Beach–Norfolk, VA | 65% | 65% | 0% | $249,000 |
| 9 | Birmingham, AL | 65% | 66% | -1% | $193,000 |
| 10 | Miami, FL | 65% | 56% | 9% | $319,000 |
| Note: Among the 100 largest U.S. metros. The two-month shares and the difference are rounded to the nearest percentage point, and the difference was calculated before rounding; therefore, the rounded difference might not equal the difference between the rounded shares. Click here to download the full results for each of the 100 largest U.S. metros. | |||||
Why do some markets speed up while others slow down? Last year we found the fastest moving markets were those that had the largest year-over-year price gains. Things don’t appear to have changed this year. In fact, asking prices increased near or above the national average of 5% year-over-year in six of the 10 fastest-moving markets.
But fast-moving markets are different in other ways, too. They tend to be more expensive to begin with. In other words, they have both higher price levels AND they’ve notched bigger price increases in the past year. Expensive markets—including many in California—have tight housing supplies because of limited construction in the face of growing demand. So homes get snapped up quickly. And this is bad news for first-time homebuyers. The combination of an expensive market and fast-selling homes at the low tier is yet another hurdle for first-timers, who are already getting slammed by declining affordability and slow wage growth. Now, even the homes they might be able to afford seem to be disappearing in the blink of an eye.


