After years of tight inventory and large price gains in several major housing markets, home buyers can breathe a sigh of relief — we’re now seeing early signs of a slowdown. But what does this mean for home buyers?
To find out, we first calculated how long homes are staying on the market by measuring the share of homes for sale on Trulia over a two-month period. We looked at homes listed on June 17, then counted how many were still for sale on August 17. Faster-moving markets had a lower percentage of homes still on the market after two months, while slower-moving markets had a higher percentage.
Our two-month measure is similar to a common housing statistic: days on market (DOM). In general, housing markets with more inventory and fewer buyers will have a higher share of for-sale homes remaining on the market after two months and a higher median DOM. But we prefer our two-month measure over the widely watched DOM as a way to determine how quickly homes are moving in a market. Why? We think DOM is potentially misleading. If lots of new inventory suddenly lands on the market, then median DOM could fall thanks to all those newly listed homes. Thus, a low median DOM might indicate that buyers are snapping up homes quickly, so homes aren’t staying on the market long (a seller’s market). But it could also signal that a lot of new inventory has just come onto the market (a buyer’s market). As a result, it’s difficult to decipher what’s really going on based on DOM alone.
Home Sales Moving Slightly Slower in 2015 Across All Price Tiers
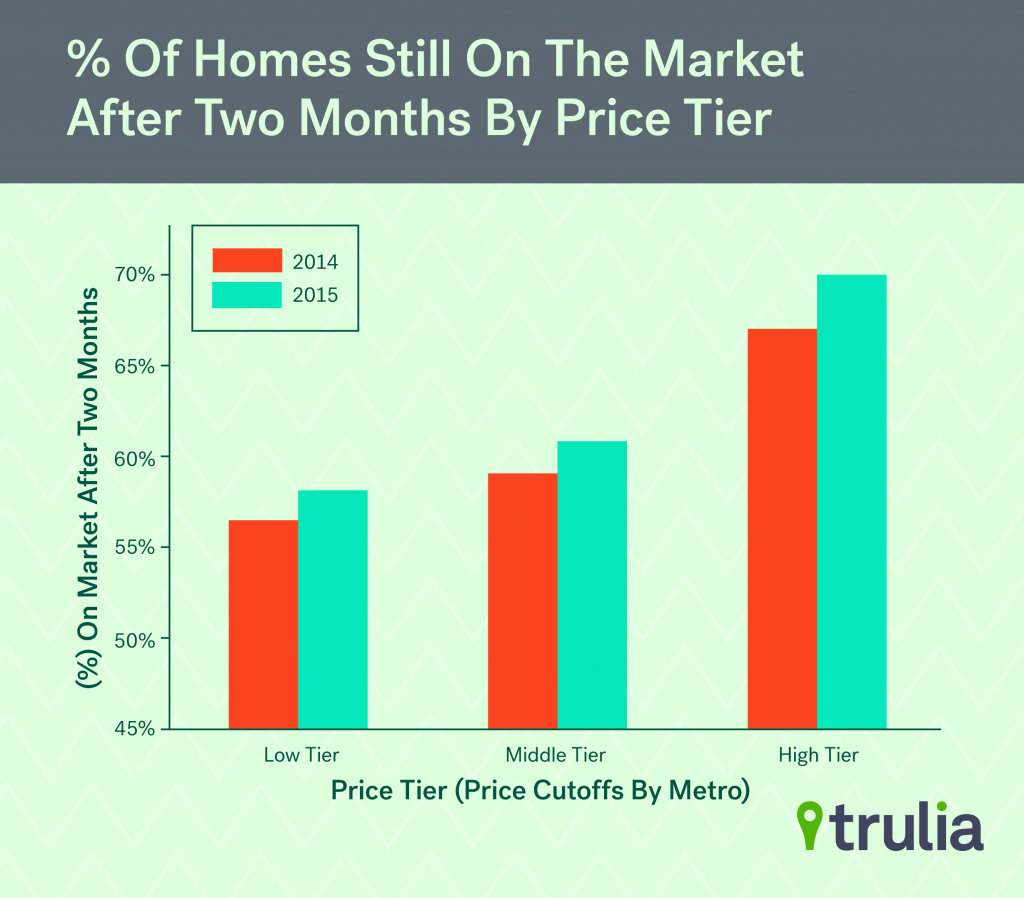
Nationally, 63% of homes listed for sale on June 17 were still on the market on August 17, which is up a bit from 61% for the same period last year. And it turns out homes across all price tiers have slowed about the same. To see this, we evenly divided all homes in each of the 100 largest U.S. metros into three price tiers based on what’s considered high-end, mid-range, and low-end locally.
Home sales in all three tiers slowed 2-3 percentage points compared with a year ago. The share of low-price and mid-priced homes still on the market after two months increased 2 percentage points, compared with a 3-point increase for high-tier homes. As always though, the national trend hides big differences from one local market to another. In many metros, the sales pace is quickening, while slowing in others.
Affordability Plays Role in California Slowdown and Southern Pickup
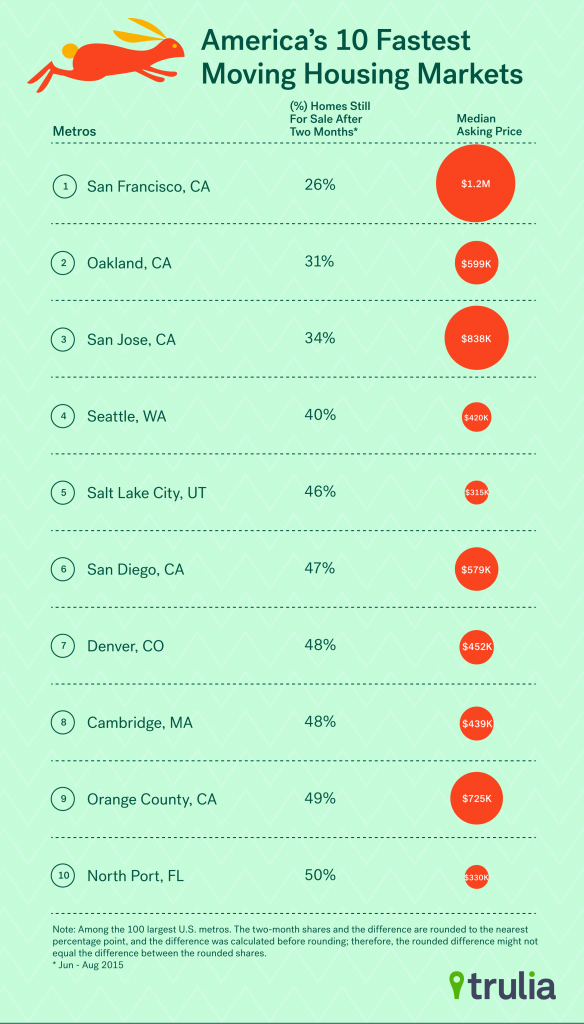
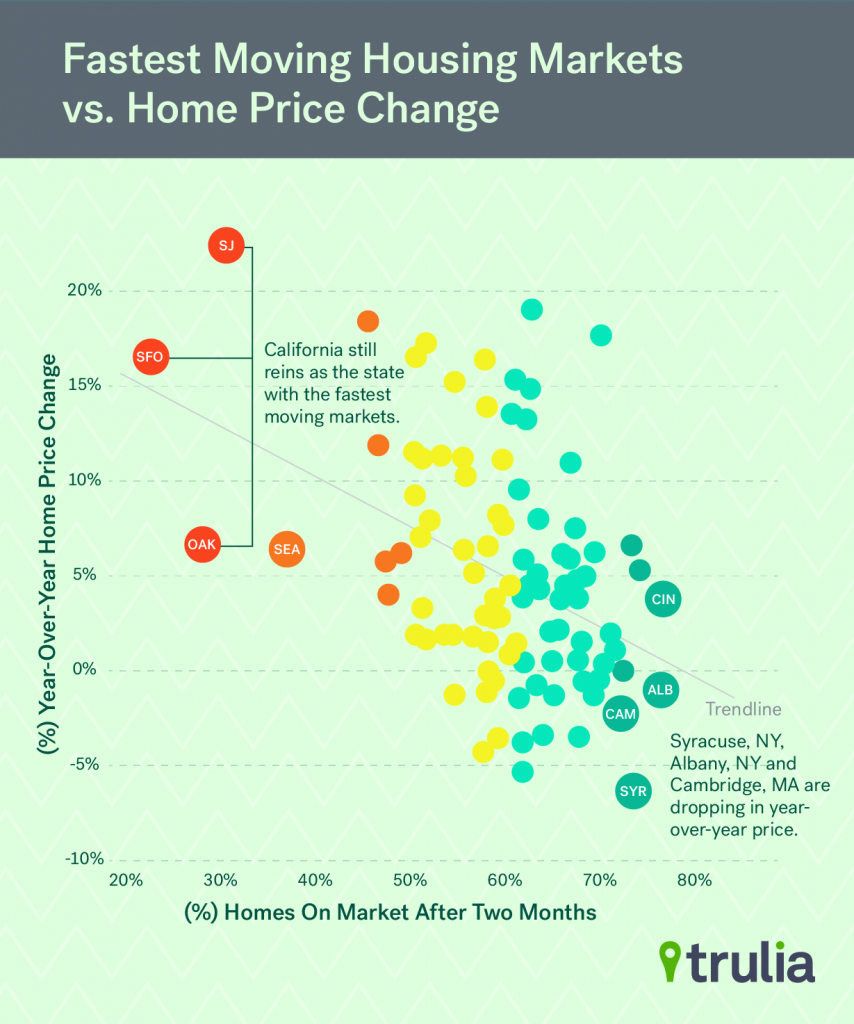
California continues to reign as the state with the fastest moving markets with San Francisco, Oakland, San Jose, San Diego, and Orange County making the top 10 list of America’s fastest moving housing markets. In fact, less than 34% of the homes for sale in the top three San Francisco Bay Area metros remained on the market after two months. But the news isn’t all bad for California home buyers. The percentage of homes still on the market after two months has increased slightly over the past year. Meanwhile, Seattle, Salt Lake City, and North Port-Bradenton-Sarasota, FL are gaining ground, having decreased between 4-7 percentage points from a year ago.
| America’s Top 10 Fastest Moving Housing Markets | |||||
| # | U.S. Metro | % of homes still for sale after two months, August 2015 | % of homes still for sale after two months, August 2014 | Difference in share still for sale, 2015 vs 2014 | Median Asking Home price, August 2015 |
| 1 | San Francisco, CA | 26% | 25% | +1% | $1,190,900 |
| 2 | Oakland, CA | 31% | 29% | +2% | $599,000 |
| 3 | San Jose, CA | 34% | 30% | +4% | $838,000 |
| 4 | Seattle, WA | 40% | 44% | -4% | $420,000 |
| 5 | Salt Lake City, UT | 46% | 52% | -6% | $314,990 |
| 6 | San Diego, CA | 47% | 45% | +2% | $579,000 |
| 7 | Denver, CO | 48% | 46% | +2% | $451,995 |
| 8 | Cambridge, MA | 48% | 46% | +3% | $439,000 |
| 9 | Orange County, CA | 49% | 46% | +3% | $725,000 |
| 10 | North Port–Sarasota – Bradenton, FL | 50% | 58% | -8% | $329,990 |
| Note: Among the 100 largest U.S. metros. The two-month shares and the difference are rounded to the nearest percentage point, and the difference was calculated before rounding; therefore, the rounded difference might not equal the difference between the rounded shares. | |||||
But housing markets in the South, which have sped up the most year-over-year, aren’t the fastest moving. The share of homes for sale in Winston–Salem, NC, which ranks #23 on the list, still on the market after two months dropped 9 percentage points from 67% in August 2014 to 58% in August 2015. Greensboro, NC and North Port-Bradenton-Sarasota, FL sped up at a similar pace, dropping 8 percentage points, followed by Charlotte, NC, and Cape Coral–Fort Myers, FL, which dropped 7 and 6 percentage points each.
So what drives a fast moving market? As with our previous findings, increases in home prices are strongly correlated with the share of homes on the market after two months.
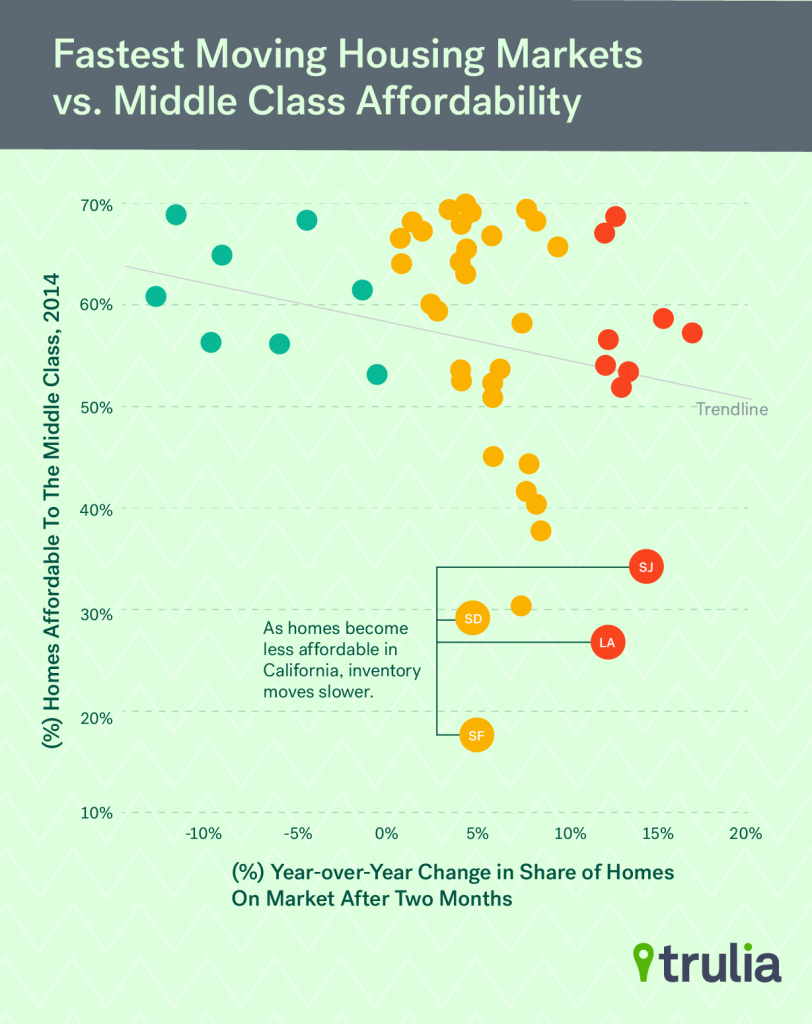
However, affordability may be starting to play a role in the priciest markets. Of the 50 most expensive housing markets, those with fewer homes for sale that are affordable to the middle class in 2014 tended to experience a slowdown. In other words, home buyers, no matter how competitive the market is, have a limit. When the stock of cheaper homes dries up, not every buyer is able to up their budget and put offers on homes in a higher price tier. So some may delay buying a home, which leads to existing homes sitting on the market a tad longer. Still, homes in these expensive markets are moving faster than other less expensive metros.
America’s Heartland: Where First-Time Home Buyers Can Take Their Time
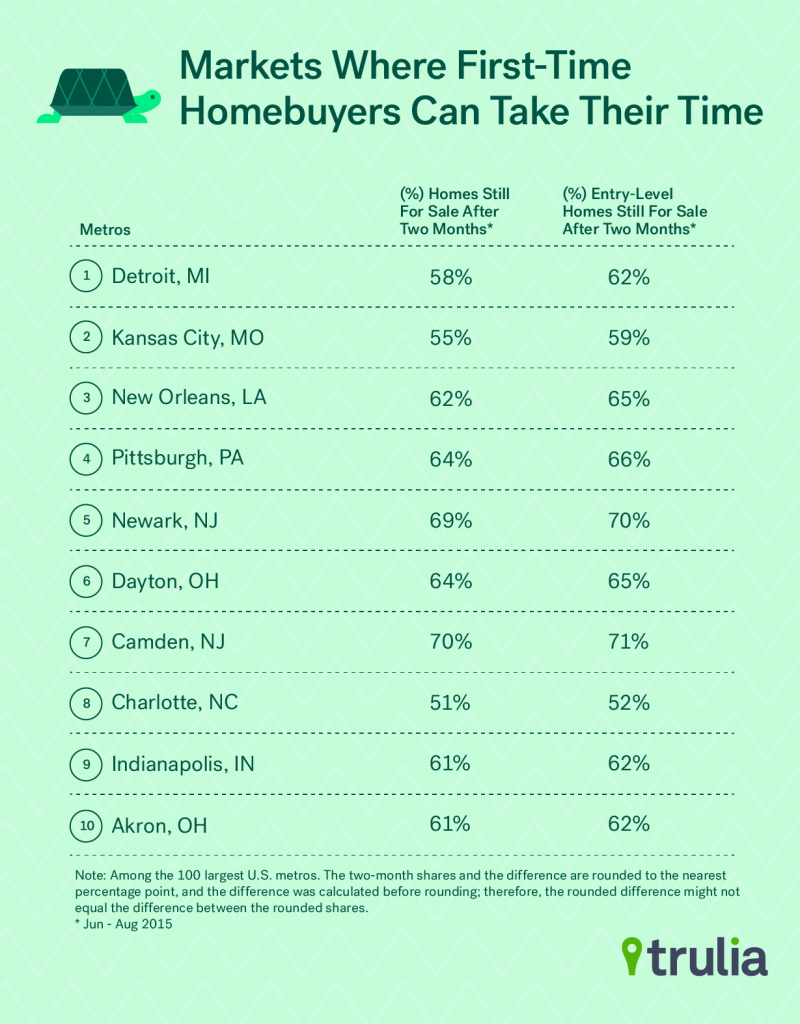
Nationally, and in 89 of the 100 largest metro areas, low-tier homes move faster than all other homes. But first-time home buyers in the Midwest and South can take their time because low-tier homes there actually move slower than the market as a whole. To see this, we evenly divided all homes in each of the 100 largest U.S. metros into three price tiers and compared how fast the lowest tier moved compared to the market as a whole.
| Where First Time Home Buyers Can Move At Their Own Pace | ||||
| U.S. Metro | % of Homes Still for Sale After Two Months, August 2015 | % of Entry-level Homes Still for Sale After Two Months, August 2015 | Percentage Point Difference between Entry-Level Homes and All Homes | Median Asking Home price, August 2015 |
| Detroit, MI | 58% | 62% | +4% | $89,900 |
| Kansas City, MO | 55% | 59% | +3% | $164,900 |
| New Orleans, LA | 62% | 65% | +3% | $187,500 |
| Pittsburgh, PA | 64% | 66% | +2% | $159,000 |
| Newark, NJ | 69% | 70% | +1% | $319,000 |
| Dayton, OH | 64% | 65% | +1% | $119,700 |
| Camden, NJ | 70% | 71% | +1% | $185,000 |
| Charlotte, NC | 51% | 52% | +1% | $235,000 |
| Indianapolis, IN | 61% | 62% | +1% | $169,950 |
| Akron, OH | 61% | 62% | +1% | $120,450 |
| Note: Among the 100 largest U.S. metros. The two-month shares and the difference are rounded to the nearest percentage point, and the difference was calculated before rounding; therefore, the rounded difference might not equal the difference between the rounded shares. | ||||
Detroit tops the list, where entry-level homes on average move 4 percentage points slower than the rest of the market. Kansas City, MO, and New Orleans both have about 3 percent more entry-level homes are on the market after two months. And that number is two percent greater in Pittsburgh, PA. There is just a one-percentage point advantage in the other six metros that round out our top 10 list of markets where entry-level homes are easier to buy.
Winter is Coming: Relief in Sight for Some Home Buyers
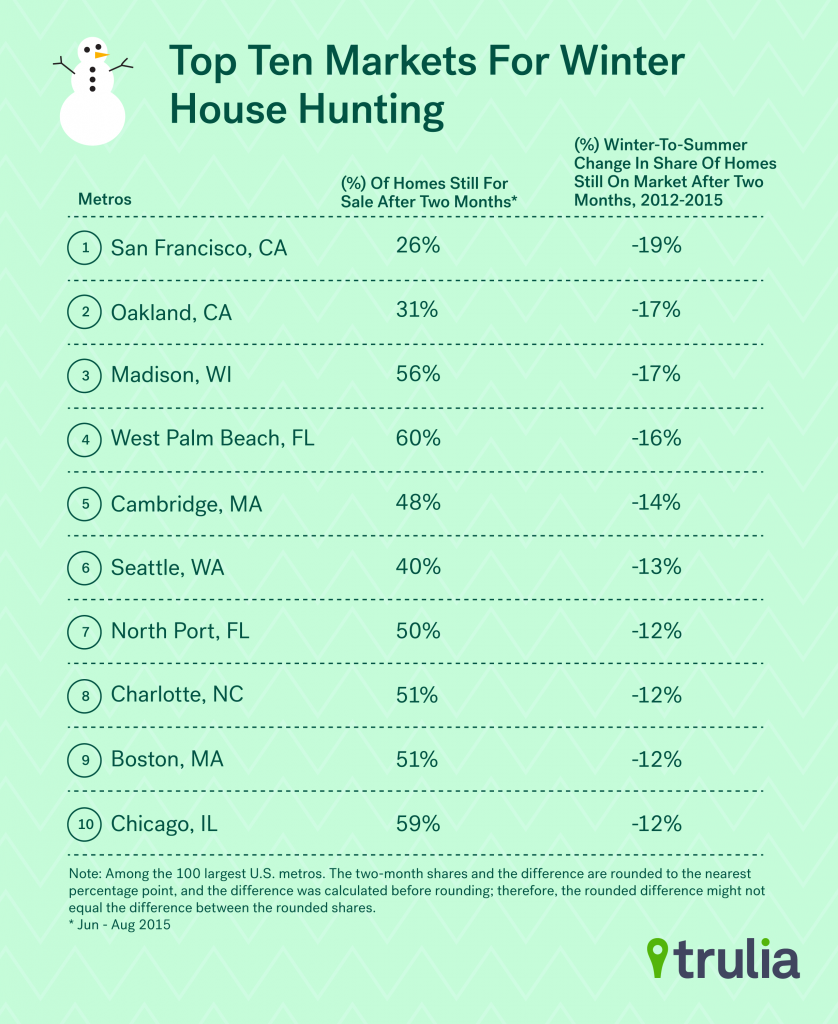
For home buyers in some of the nation’s most competitive housing market, waiting to buy in the winter just might pay off. To figure out whether seasonality plays a role in how fast markets move, we calculated how long homes stay on the market in the summer versus the winter. As it turns out, those living in five of the fastest moving markets this summer also top the list of metros with the largest winter-to-summer change in the share of homes still on the market after two month. For example, in pricey San Francisco and Oakland, CA, the pace of sales increased by 19% and 17% (proportion increase, not percentage points!) between winter and summer over the past three years. In Cambridge, MA, Seattle, WA, and North Port-Bradenton-Sarasota, FL, the increase is between 12% and 14%. So home buyers who were not able to close on the home of their dreams in the fastest moving markets this summer might have better luck come winter.
| Where Winter Brings Home Buyers Relief | ||||
| # | U.S. Metro | % of homes still for sale after two months, August 2015 | Winter-to-Summer % Change in Share of Homes Still on The Market After Two Months, Three-Year Average, 2012-2015 | Winter-to-Summer Price Change (%), Three Year Average, 2012-2015 |
| 1 | San Francisco, CA | 26% | -19% | 12% |
| 2 | Oakland, CA | 31% | -17% | 25% |
| 3 | Madison, WI | 56% | -17% | 9% |
| 4 | West Palm Beach, FL | 60% | -16% | 0% |
| 5 | Cambridge, MA | 48% | -14% | 11% |
| 6 | Seattle, WA | 40% | -13% | 13% |
| 7 | North Port–Sarasota–Bradenton, FL | 50% | -12% | 6% |
| 8 | Charlotte, NC | 51% | -12% | 9% |
| 9 | Boston, MA | 51% | -12% | 9% |
| 10 | Chicago, IL | 59% | -12% | 16% |
| Note: Among the 100 largest U.S. metros. The two-month shares and the difference are rounded to the nearest percentage point, and the difference was calculated before rounding; therefore, the rounded difference might not equal the difference between the rounded shares. | ||||
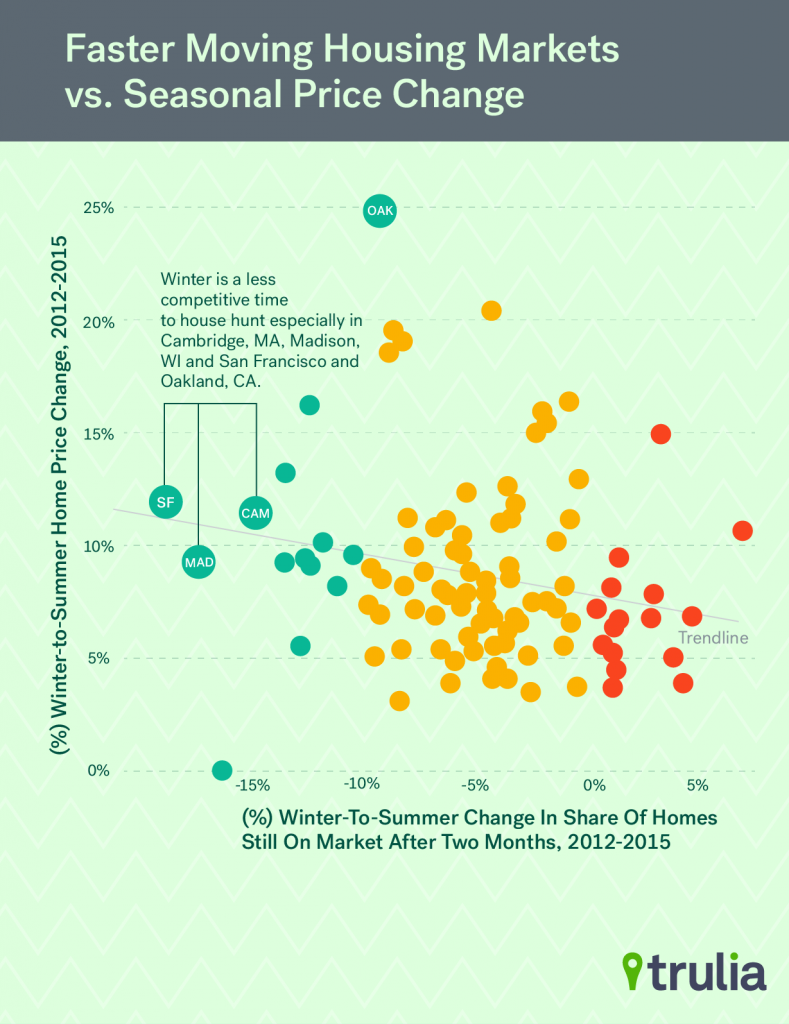
Just as we found earlier this year, the fastest moving markets were those that had the largest year-over-year price gains. San Francisco and Oakland, which have a greater winter-summer differential, also tend to have larger swings between winter and summer prices. To see this relationship, we calculated the average seasonal increase in median asking price between winter and summer, and then compared it to the winter-to-summer differential in the share of homes on market after two months. As it turns out, there is a moderate and negative relationship between the two – which means markets that see larger seasonal price spikes tend to move proportionally faster during the summer.
Consolation Relief For First-Time Home Buyers
All of this should be taken as consolatory news for first-time home buyers. In our last two fastest moving market reports, we found that not only were for-sale homes moving faster than the year before, but that cheaper homes moved much faster than expensive homes — and had been increasing in speed year-over-year.
That story has changed course this summer. Compared to last year, a larger share of homes are staying on the market after two months. Even the fastest moving markets have slowed down somewhat. Moreover, in a handful of markets, first-time home buyers looking for entry-level homes can actually take their time to find their dream home. So what this means for first-time home buyers is that they can be cautiously optimistic that normality may be creeping in on what has been an otherwise difficult marketplace over the past two years.
