
So of the two presumptive major-party nominees for U.S. presidency, whom do you think will be best for housing prices? The self-described successful real estate executive Donald Trump? Or the former U.S. Senator, first lady and U.S. Secretary of State, Hillary Clinton?
Americans appear to have more faith in Trump. When asked what would likely happen to home prices if either Trump or Clinton were elected, 39% of Americans said prices would rise a little or a lot if Trump was elected compared to 29% for Clinton, according to survey conducted online by Harris Poll on behalf of Trulia. The survey was conducted from June 7-9, 2016, among 2,034 U.S. adults ages 18 and older. In addition:
- Nearly half of Democrats, 47%, said housing prices would likely rise if Trump were elected, compared to just 24% of Democrats who said the same about Clinton.
- Likewise, 38% of Republicans said home prices would rise if Clinton were elected, 33% said the same should Trump be elected.
- Americans who identified as Independents also were more likely, 34% to 28% to foresee rising housing prices under Trump than Clinton. Forty-four percent of unmarried respondents and 46% or renters also saw higher housing prices under Trump, compared to 26% of unmarried respondents and 26% of renters for Clinton.
- Millennials and younger voters, aged 18-34, were more likely to believe housing prices would rise under Trump vs. Clinton, by a margin of 49% to 26%.
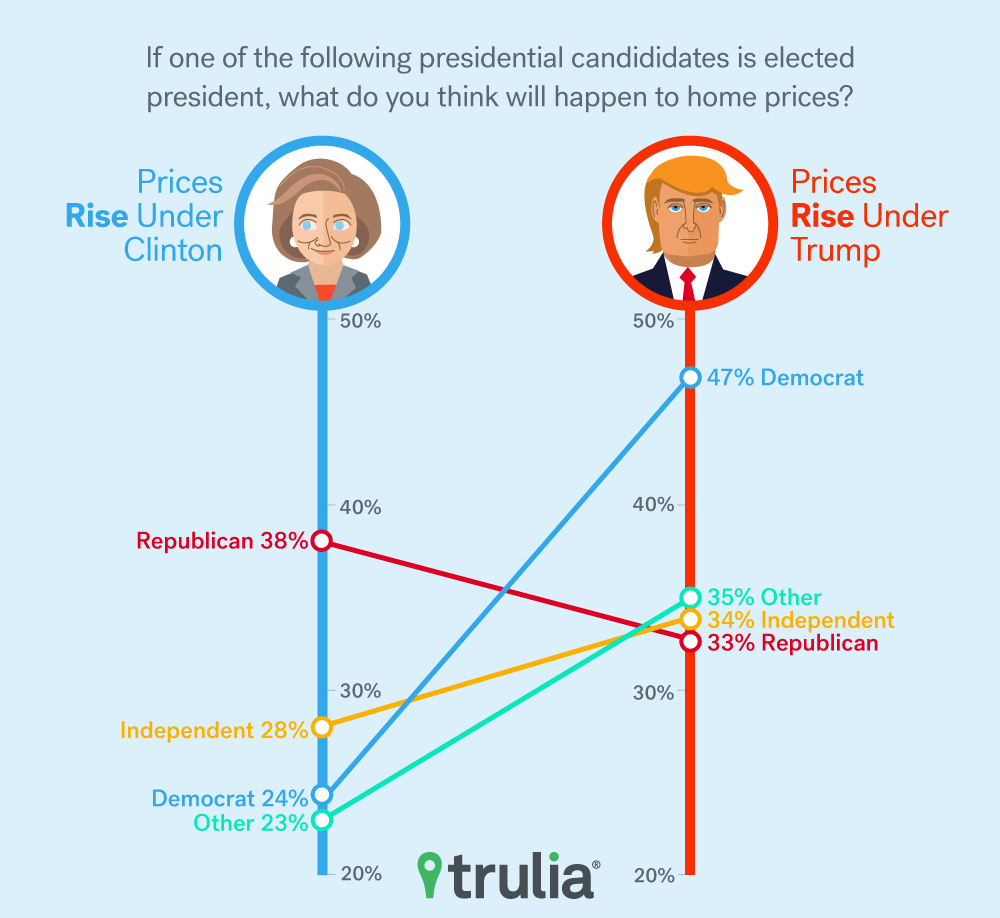
Q. If each of the following presidential candididates is elected president in November, what do you think will happen to home prices?
A. They will RISE a lot/a little.
| Republican | Democrat | Independent | Other: Pol. Affil. | Age 18-34 | Men | Women | Total | |
| Donald Trump | 33% | 47% | 34% | 35% | 49% | 37% | 40% | 39% |
| Hillary Clinton | 38% | 24% | 28% | 23% | 26% | 33% | 25% | 29% |
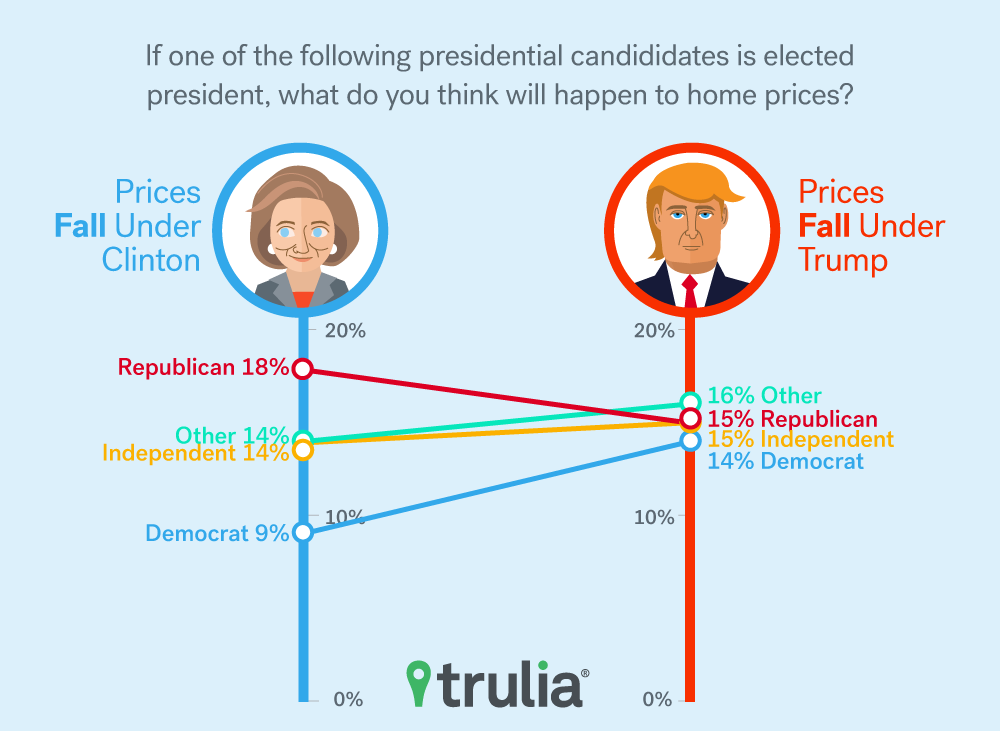
A. They will FALL a lot/a little.
| Republican | Democrat | Independent | Other | Age 18-34 | Men | Women | Total | |
| Donald Trump | 15% | 14% | 15% | 16% | 14% | 17% | 14% | 15% |
| Hillary Clinton | 18% | 9% | 14% | 14% | 12% | 16% | 11% | 13% |
The results stand in contrast to a Zillow survey of more than 100 economists and real estate experts. That report, which was published May 17 and included other candidates who had not yet dropped out of the race, found that Clinton would have the most positive net effect on the housing market – though it did not distinguish if that would mean higher or lower housing prices.
Ralph McLaughlin, Trulia’s chief economist, notes that Americans probably don’t have much information about either candidates’ positions on the U.S. housing market.
“Voters shouldn’t necessarily be surprised by the little attention that Hillary Clinton and Donald Trump have paid to housing this election cycle,” McLaughlin said. “Eight years ago, housing and the economy were the main talking points of Obama and McCain because millions of homeowners were going through foreclosure and the economy was in shambles.
“Today, the housing market and US economy look much healthier, and as such, candidates have turned their attention to more popular issues such as immigration, gun control, and national security.”
McLaughlin added that there has been some position-taking on housing. A big chunk, $25 billion of her proposed $125 billion Economic Revitalization Initiative, is targeted towards facilitating homeownership among households that have been traditionally underserved.
Trump has spoken about eliminating the U.S. Department of Housing and Urban Development – the primary federal source of funding for affordable housing, McLaughlin said.
We also asked Americans if they would make any housing decisions based on the election of either candidate:
Thinking about your living situtation in the next two years, if each of the following presidential candidates is elected president in November, which of the following would you be more likely to do because of their election?
| Clinton | Trump | |
| Buy a home | 6% | 6% |
| Go from renter to owner | 4% | 3% |
| Sell a home | 2% | 4% |
| Start renting | 2% | 2% |
| Something else | 7% | 9% |
| Change nothing about my living situation | 79% | 78% |
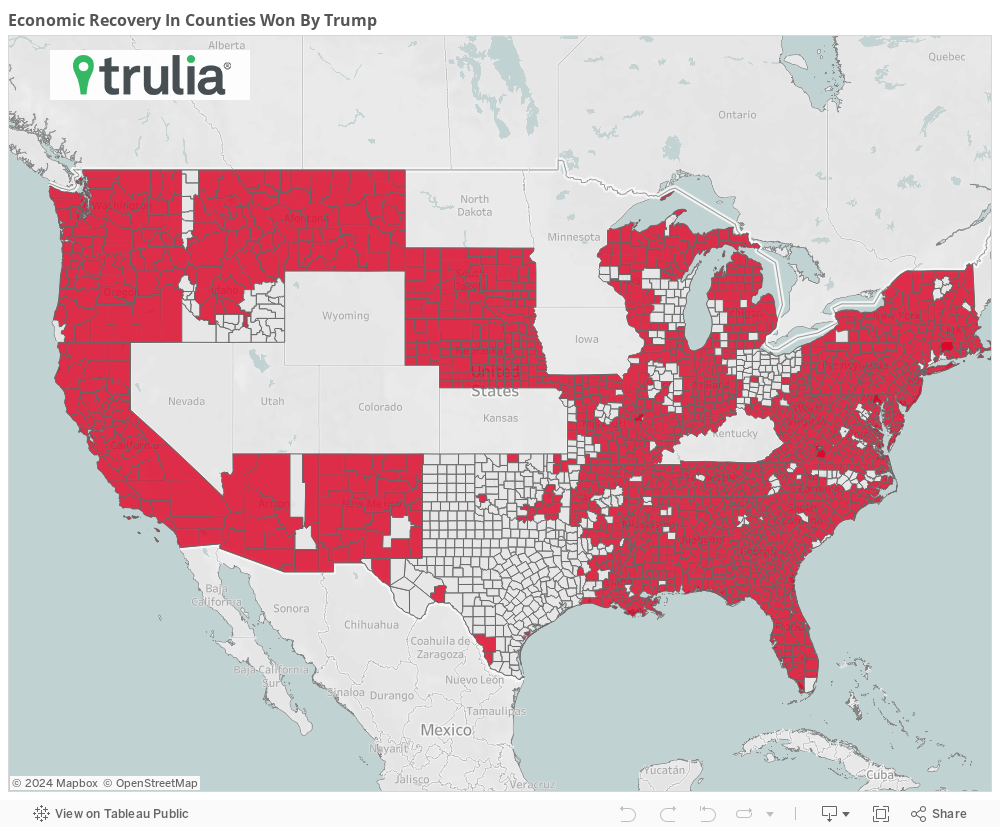
Housing price recovery was stronger in states Clinton and Trump lost
Americans gave an overall edge to Trump in our poll when it came to a strong (higher-priced) housing market. During the primary season, however, both candidates performed better in counties where housing prices had risen only slightly since deepest part of the recession – when unemployment was at its highest level – the second quarter of 2009. For instance:
- In counties that Clinton won during primary season, combined housing prices rose 3.1%. In counties she lost, almost all to Vermont Senator Bernie Sanders, prices rose 7.1%.
- Likewise, Trump won counties that saw combined housing price appreciation of 4.2%. He lost counties that had a combined price increase of 6.6%.
- Trump tended to lose in counties where employment, or job growth, was strong in the recovery.
|
Economic Change Q2 2009-Q4 2015 |
||||
| Clinton | Trump | |||
| Won | Lost | Won | Lost | |
| Employment growth | 2.4% | 2.1% | 1.7% | 4.2% |
| Wage growth | 15.7% | 17.0% | 15.9% | 17.5% |
| Unemployment rate* | -26.8% | -26.0% | -26.2% | -27.5% |
| Home Price growth | 3.1% | 7.1% | 4.2% | 6.7% |
| *measures the percentage-point change in unemployment rate. | ||||
Methodology
Wage, covered employment, and unemployment rate data were pulled from the Bureau of Labor and Statistics’ (BLS) Quarterly Census of Employment and Wages (QCEW) and Local Area Unemployment Statistics (LAUS) programs. The 4-quarter (or 12-month) rolling average was taken for all BLS metrics and used to compare employment/labor market conditions from Q2 2009 to Q4 2015.
Finally, the percent change in the 12-month rolling Zillow Home Value Index (ZHVI) by county was used to compare Q2 2009 prices with Q4 2015 prices.
The survey portion of the report was conducted online within the United States by Harris Poll on behalf of Trulia from September 14-16, 2015 among 2,031 U.S. adults ages 18 and older, and June 7-9, 2016 among 2,034 U.S. adults ages 18 and older. These online surveys are not based on a probability sample and therefore no estimate of theoretical sampling error can be calculated. For complete survey methodology, including weighting variables, please contact dweidner@trulia.com.

