The U.S. housing market continues to surge with higher prices and fewer homes to meet demand. But during the last year more landlords and sellers have cut prices and rents for properties – a sign some markets may be softening.
We looked at more than a year’s worth of pricing data in both the rental and sale markets and found a significant shift in the number of properties in which initial listing prices were cut. For rentals we found:
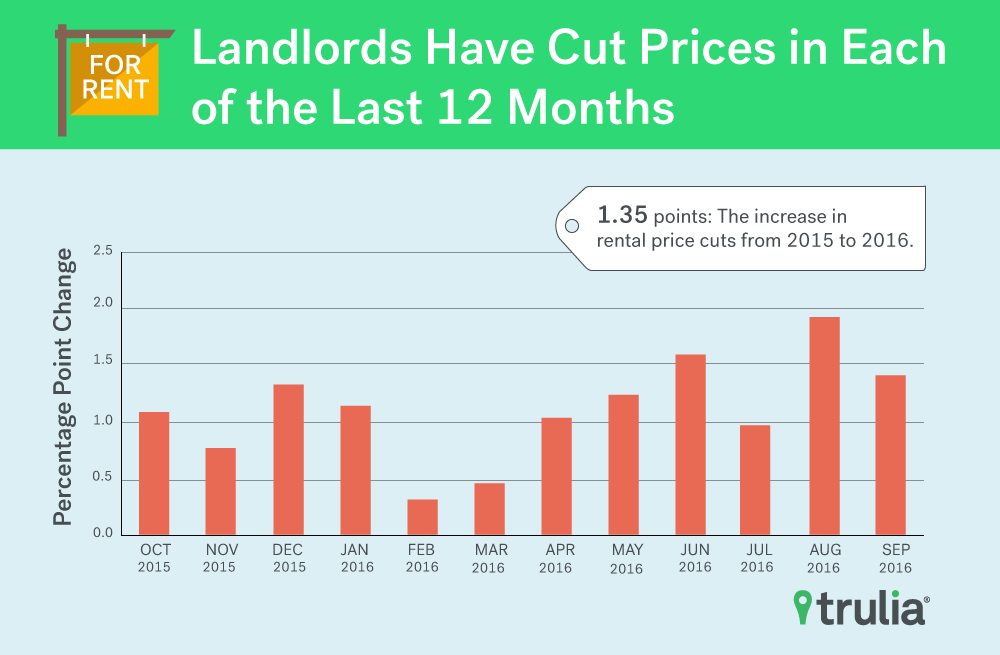
- Between October 2015 to September 2016 the number of price reductions for rental listings nationally increased 1.35 percentage points to 9.32% from 7.97% of rental listings the prior year (October 2014 to September 2015).
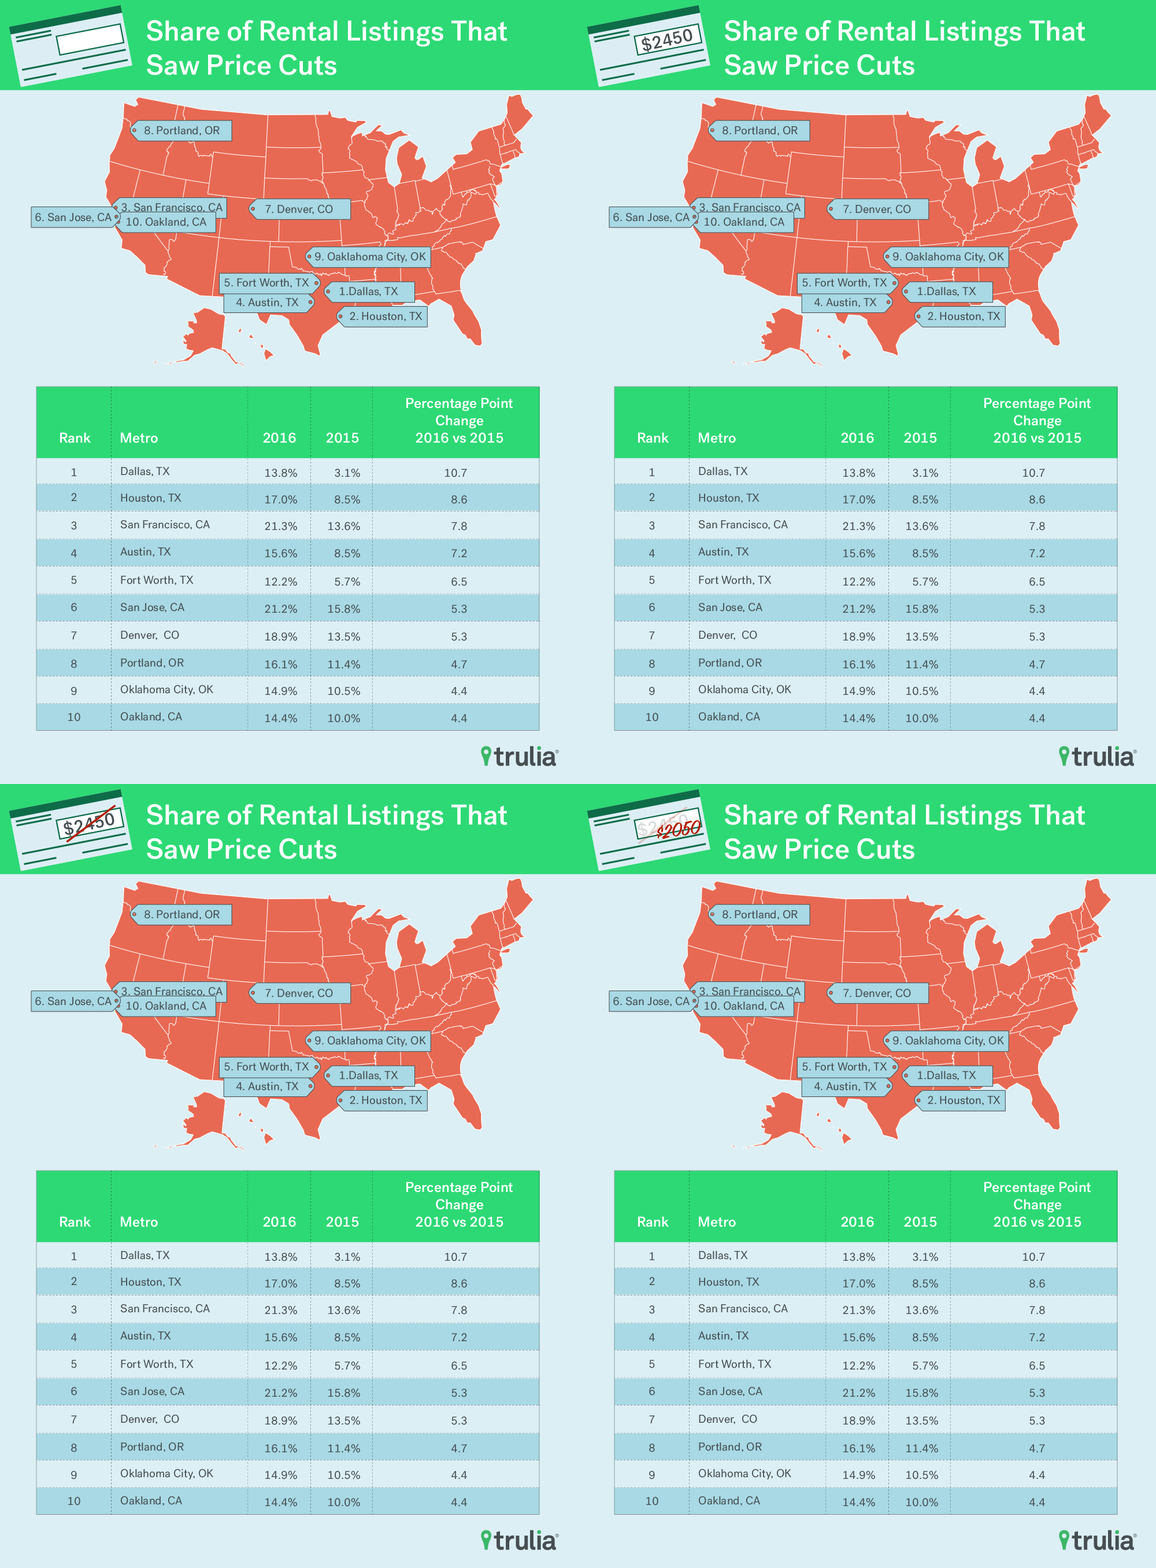
- Eighty of the top 100 metro areas saw the share of rental listings that had a price reduction increase from last year to this year.
- Texas markets dominated the list when it comes to the increase in percentage of listings with price reductions. Dallas led with a +10.74 pp change, followed by Houston with +8.58 pp, Austin, Texas at No. 4 with +7.18 pp, and Fort Worth, Texas with +6.50 pp.
- Bay Area markets, San Francisco (+8.58 pp) and San Jose, Calif., (+5.34 pp) were Nos. 3 and 6, respectively.

For the sales market we found:
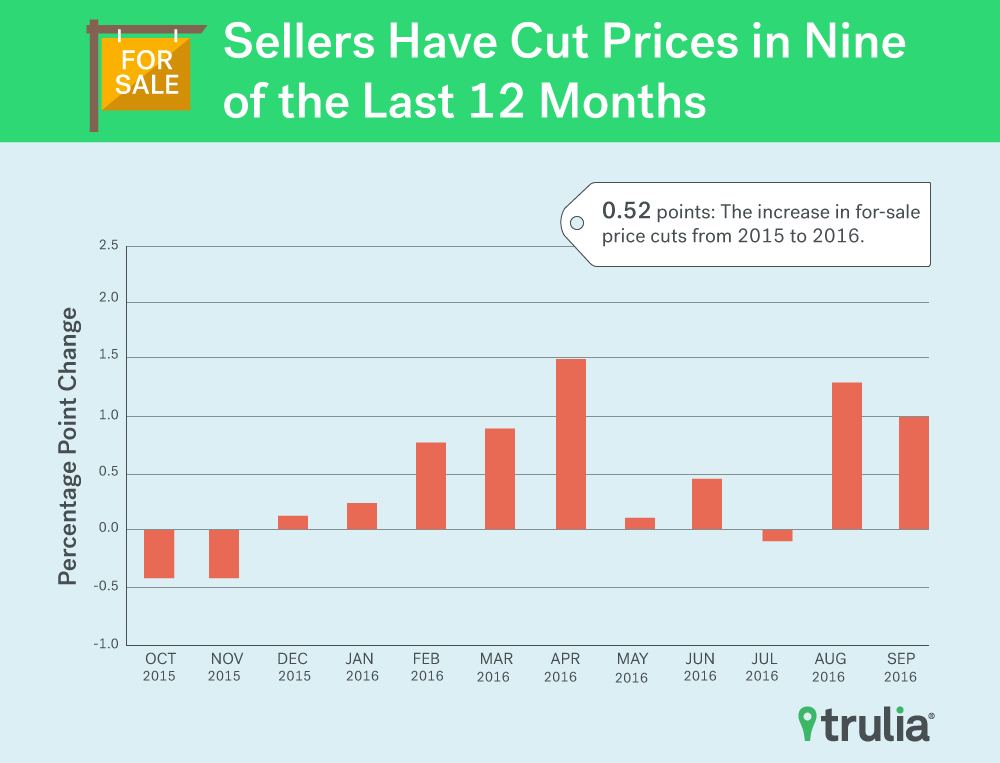
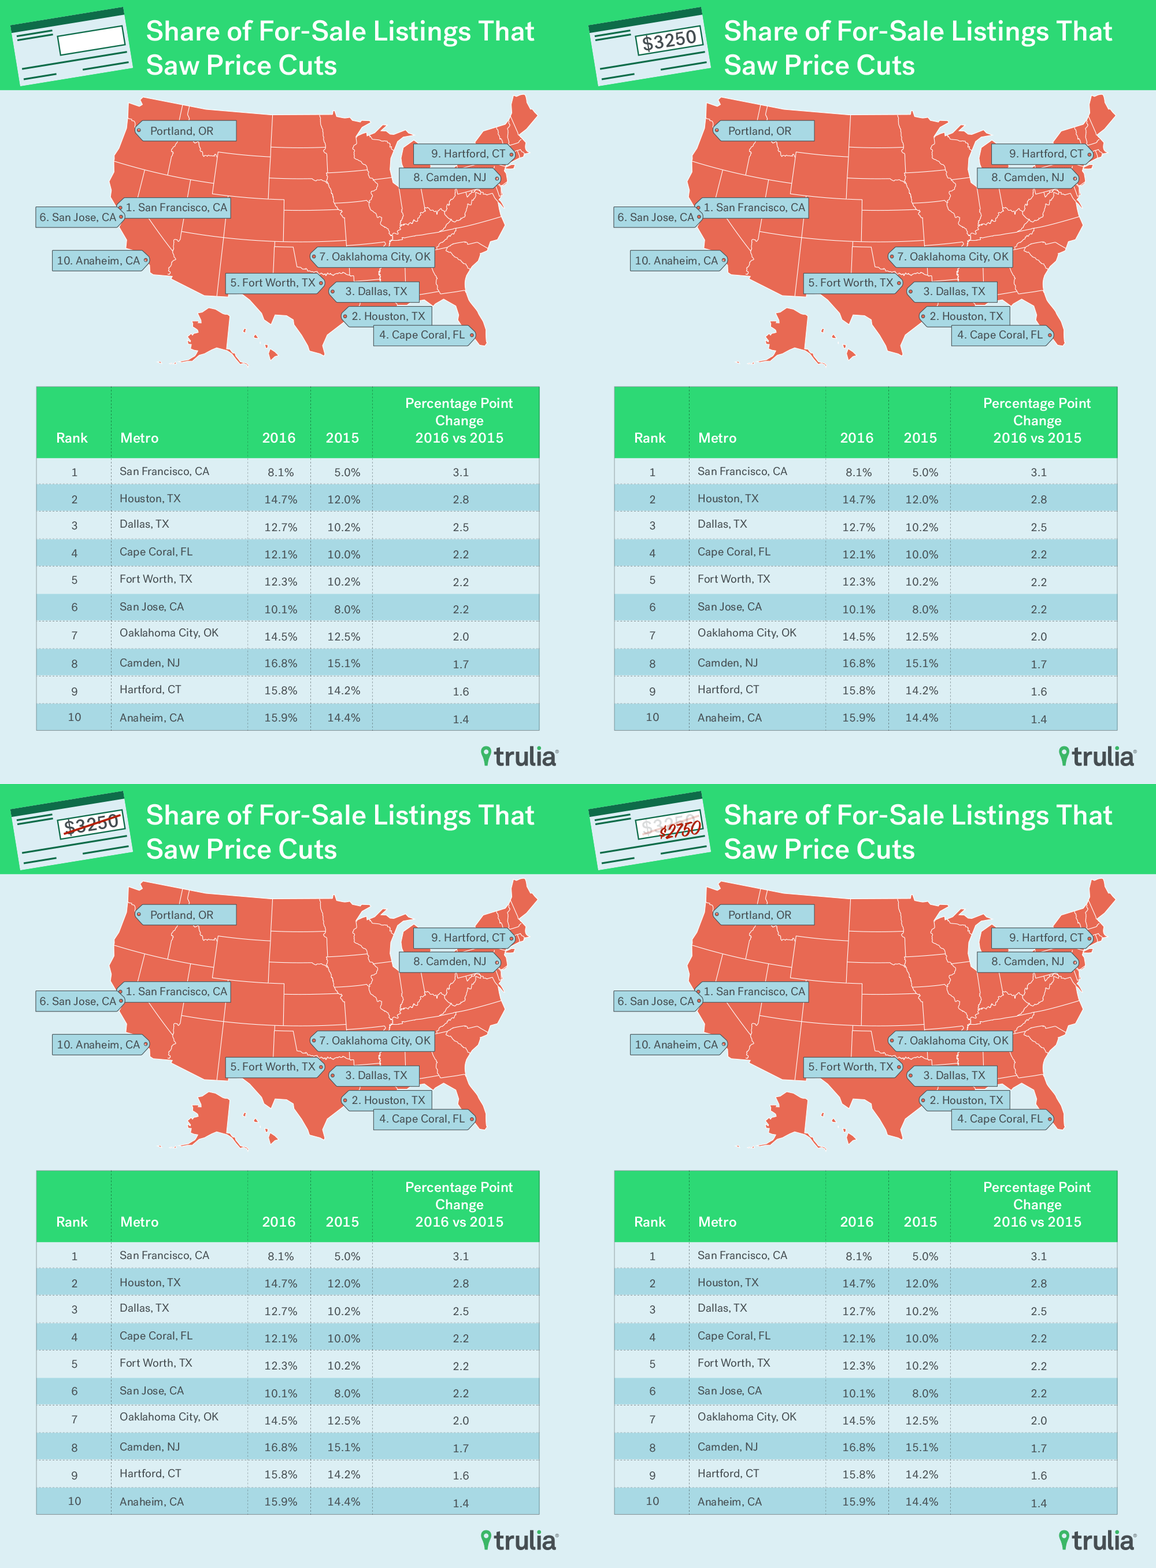
- Seventy of the 100 largest metros saw the share of for-sale listings with a price reduction increase from last year to this year. Nationally the increase was 0.52 percentage points.
- San Francisco came on top with a 3.07 pp increase in price reductions. That said the San Francisco remains a very hot market as only 8.06% of listings saw a price reduction this year, which is the second lowest out of the top 100 metros. Last year, only 4.99% of listings in SF saw a price reduction, which was the lowest out of the top 100 metros.

The rise in price cuts jibes with reports suggesting ever-rising rents and prices may be hitting a ceiling. The San Francisco Chronicle pointed out in June that many landlords are offering one month free rent. A Bloomberg news article noted in July that a large corporate landlord is slashing revenue projections based on stagnating rents.
In each month this year, the share of listings that saw price reductions was higher than that in the month exactly one year ago. The fact that this year-over-year figure has also been trending higher in the past several months also supports the notion that the rental market is softening. Make no mistake. This is not to suggest rental rates are declining. In fact, the median listing rent has edged 0.31% higher from last year to this year. What we are saying though is that market participants might be showing signs of capitulation and exhaustion from these ever high prices.

The for-sale market has also shown signs of softening when comparing this year to last year. This year, 10.66% of for-sale listings saw price reductions, which is 0.52 percentage points higher than the 10.14% figure from last year. Most months in 2016 exhibited a higher proportion of for-sale listings with price reductions compared to months exactly one year ago as shown in the line chart below. Again, we are not arguing that home prices have been declining. In fact, the median for-sale listing prices increased 6.8% from last year to this year. What our study does tell you, however, is that the market might be showing signs of softening.
It could be that landlords and sellers listed their properties too high the first time around. Perhaps it’s taking property owners a bit longer to sell or rent than you thought. One solution may be to list the property a smidge lower (albeit still at a higher price than what you would have listed your house for the same time around last year) in order to attract more potential buyers or potential tenants. Such eye-blinking behavior or lesser degree of confidence is captured by the increase in the share of listings that saw a price reduction.
Price reductions exhibit seasonality as shown in the chart below. The percentage of listings experiencing price reductions on the for-sale side decreases from October through December, but it does increase steadily January through September. On the rental market side, the percentage of listings experiencing price reductions decreases from October through April, and increases from May through September. While not a perfect mirror, the rental and for-sale market seem to move somewhat in tandem when it comes to the share of price reductions. Most importantly, price reductions are more common in 2016.

Furthermore, the median price reduction (by % of listing price) has been stable over time on a monthly basis. On the rental market side, the median price reduction each month from October, 2014 through September 2016 fluctuated between 4% and 4.7%, and on the for-sale side between 3.3% and 4.4%. Similar stability can be seen in 25th and 75th percentile price reduction numbers from our rental and for-sale listings on a monthly basis. This stability in price reductions across the distribution indicates a trend rather than a statistical blip.
Among our findings for the rental market:
- Denver (+5.32 pp) and Portland, Ore., (+4.73 pp), – West Coast markets that are considered hot, were ranked high at #7 and #8, respectively.
- Chicago bottomed this list with a 31 pp decrease in the share of listings with price reductions. Chicago was followed by Columbia, S.C., (-1.27 pp), Washington (-1.26 pp), Memphis, Tenn., (-1.01 pp), and Boston, Mass., (-0.84 pp).
These rental markets already may be seeing a big portion of listings seeing price reductions last year and had less room for an increase. They also may be extremely competitive markets with lots of people looking to rent and not enough rentals. Chicago falls into the first category. Boston, Columbia, and Memphis fall into the second category. Washington is a little bit of both first and second.
When it comes to the percentage of rental listings that experienced a price reduction this year:
- Bay Area metros San Francisco (21.31%) and San Jose, Calif. (21.17%) had the highest share of rental listings that saw price reductions. They were followed by Denver (18.86%), Houston (17.04%), Portland, Ore. (16.08%), and Seattle (15.83%).
- Boston, Mass. (4.83%) was at the bottom of this list, followed by Long Island, N.Y. (5.00%), Fresno, Calif. (5.14%), Providence, R.I. (5.30%), and Worcester, Mass (5.59%)
Repeating the exercise for for-sale listings, we ranked the 100 largest metros based on the change in % of for-sale listings that experienced a price reduction from last year to this year. We found:
- The change in the share of for-sale listings with a price reduction were generally smaller in magnitude than the change in the share of rental listings with a price reduction.
- San Francisco was followed by Houston (+2.84 pp), Dallas (+2.53 pp), Cape Coral, Fla. (+2.19 pp), Fort Worth, Texas (+2.18 pp) when it comes to the largest increases in price reductions from last year to this year.
- Dayton, Ohio (-2.02 pp), Sacramento, Calif (-1.79 pp), Salt Lake City, Utah (-1.34 pp), Columbus, Ohio (-1.23 pp), and Seattle, Wash. (-1.13 pp) bottomed out this ranking.
Share of Rental Listings With a Price Cut
Share of For-Sale Listings With a Price Cut
Methodology
This report was developed using Trulia’s For-Sale and Rental listing data. The report uses the entire price history of every listing found on Trulia’s website, for both rental and for-sale, dating back to October 1st of 2014 and up until September 30th of 2016. We calculated the total number of unique properties in each month. In addition, we calculated the number of unique properties each month that saw at least one price reduction. This enabled us to calculate the percentage of listings that saw a price reduction. Metro areas found in this report are metropolitan divisions where available, but are otherwise metropolitan statistical areas.


