In the monthly employment report for March, the Bureau of Labor Statistics (BLS) reported this morning that residential construction jobs increased 3.8% year-over-year. (We include both “residential building construction” and “residential specialty trade contractors” – here’s why.) That’s faster than the overall employment increase of 1.4% – reflecting that housing is now a critical part of the economic recovery.
A quick glance suggests that construction jobs aren’t keeping up with construction activity. Even though residential construction employment growth is outpacing overall employment growth, it’s puny relative to the rebound in construction activity, measured in housing units or dollars:
|
The Housing Recovery: Jobs, Housing Units, and Dollar Value |
||
|
% Change Y-o-Y |
% Change since bottom |
|
| Residential construction jobs |
3.8% |
7.0% |
| New housing units under construction |
28% |
39% |
| Dollar value of residential construction
(new construction only) |
34% |
50% |
| Dollar value of residential construction
(new construction plus improvements) |
18% |
32% |
| Note: Jobs data through March 2013, from BLS; units under construction and dollar values through February 2013, from Census. Dollar values are adjusted for inflation and reflect the cost of labor, materials, contractor’s profit, and more. “Bottom” was January 2011 for jobs; Aug 2011 for units; May 2011 for dollar value (new only); and July 2011 for dollar value (new plus improvements). | ||
A key reason for this seemingly slow rebound in construction jobs is that construction activity (in units or dollar value) fell much more than employment did after the housing bubble burst. Economists point to “labor hoarding”: firms often hold onto more workers than they need in temporary downturns if the cost of firing, re-hiring, and re-training is high relative to keeping them on. That means jobs declined less than construction activity during the bust and are therefore now rebounding less.
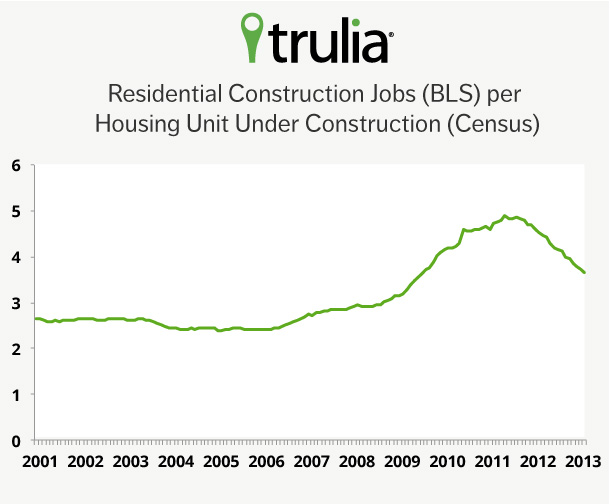
But look beyond just the most recent years, and it becomes clear that construction employment is actually high relative to the amount of construction activity. Let’s look at the number of jobs per unit under construction. The higher that number is, the more workers there are relative to the level of activity, so a higher number would look like a labor surplus, while a lower number would signify more of a labor shortage. The February 2013 level of 3.7 was lower than in 2010, 2011, and 2012, when there were as many as 4.9 jobs per unit under construction, but higher than the years during and before the bubble. In 2001, before the bubble went into high gear, there were 2.6 jobs per housing unit.
That means the number of construction jobs relative to construction activity today (3.7) is high relative to the pre-bubble level (2.6) – 40% higher, in fact. Furthermore, the jobs-relative-to-activity number is still 26% higher than the pre-bubble level when we use dollar value (including remodeling) instead of units as the level of activity.
As always, housing is local, and some markets buck the national trend. Between 2006 and 2012, permitting activity fell less (or even increased, believe it or not) than construction employment did in several markets. These metro areas where the supply of construction labor is tighter now than during the bubble include Washington, D.C., Denver, Seattle, San Francisco, San Jose, Orange County, CA, and San Diego. But these markets are the exceptions. In most of the country, employment relative to construction activity is high now compared with the bubble and pre-bubble years.
Therefore, as the housing market continues to recover, jobs and activity will both keep increasing, but the number of jobs per unit under construction should go down, not up, as it moves back toward its pre-bubble level. For the number of jobs relative to activity to get back to normal levels, jobs will continue to grow more slowly than construction activity. For builders who are reporting labor shortages today, that headache is likely to get worse, not better, as the recovery continues.


