After nearly a decade and more than 6 million foreclosures since the start of the housing crash, the Trump administration is set to review a key agency that aids home borrowers with loan disputes.
The Consumer Financial Protection Bureau (CFPB) opened in July 2011, and the agency reported that in its first five years it has returned more than $11.8 billion from financial institutions on behalf of 29 million consumers. That tally includes money recovered by consumers through CFPB dispute resolution.
In February, President Donald Trump ordered a review of Dodd-Frank and the CFPB. And just last week, he reiterated his intention to streamline, or even “eliminate” all or part of the law. Congress also is considering a bill that would change the CFPB’s leadership, size and mission.
That could be a blow for thousands of mortgage borrowers who have used the CFPB’s dispute resolution to act as an intermediary in their cases. Borrowers can file a claim when a payment isn’t posted or is erroneously posted late, when a bank moves to foreclose without notice or when they want to dispute charges – anything really. The borrowers don’t always win, but the CFPB offers the much-needed guidance and consumer protection that was sorely lacking a decade ago.
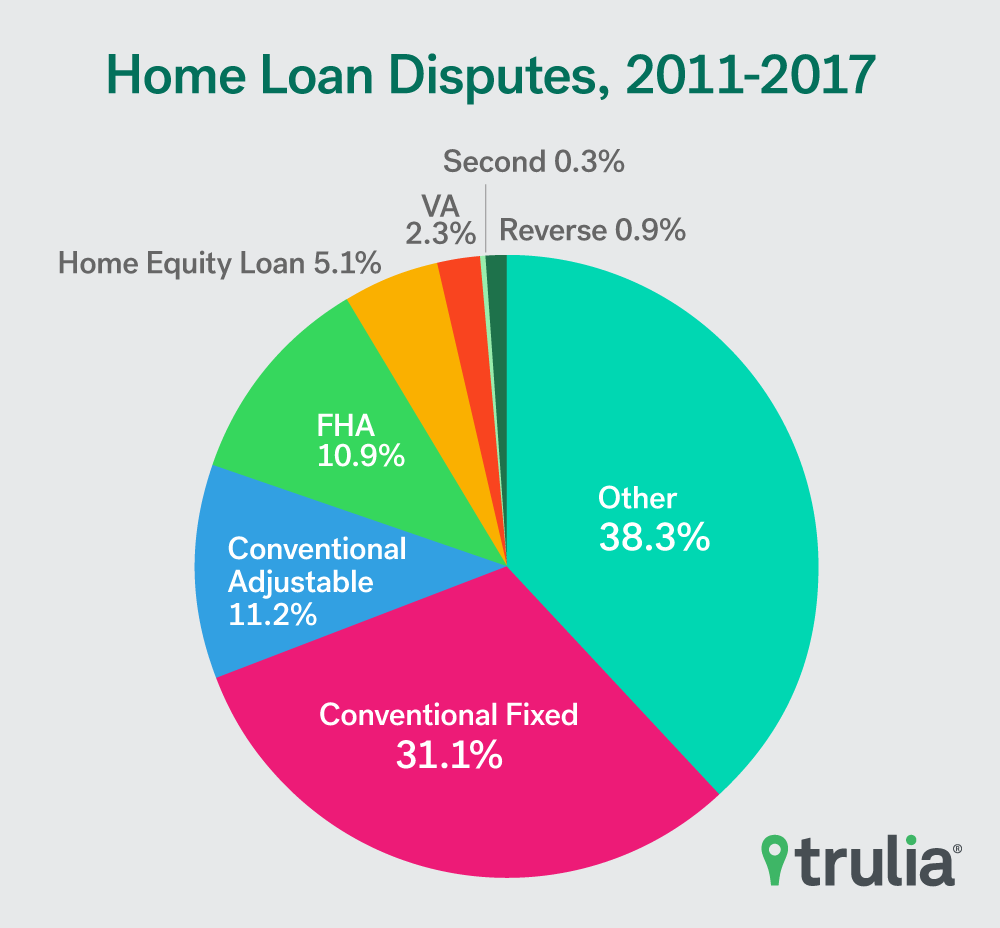
With this critical piece of post-crisis regulation under review, we take a look at the CFPB’s impact in the mortgage market. We examine where consumers have asked the bureau for help in resolving mortgage disputes, who’s doing the asking and what types of loans the CFPB deals with the most. We found:
- Nationally, the CFPB has handled 224,796 home loan complaints, or about 42,000 a year, since the bureau started tracking complaints on Dec. 1, 2011. This represents 0.46% of all outstanding mortgages as reported by the U.S. Census Bureau.
- Miami, (1.6% of all mortgages held in the zip code), Asheville, N.C., (1.53%), and Atlanta, (1.46%), zip codes have the highest rates of mortgage complaints at the CFPB. The New York metro has three zip codes with high complaint rates that land in the top 10: New Rochelle, (1.25%), Far Rockaway (1.23%) and New York City (1.14%) itself.
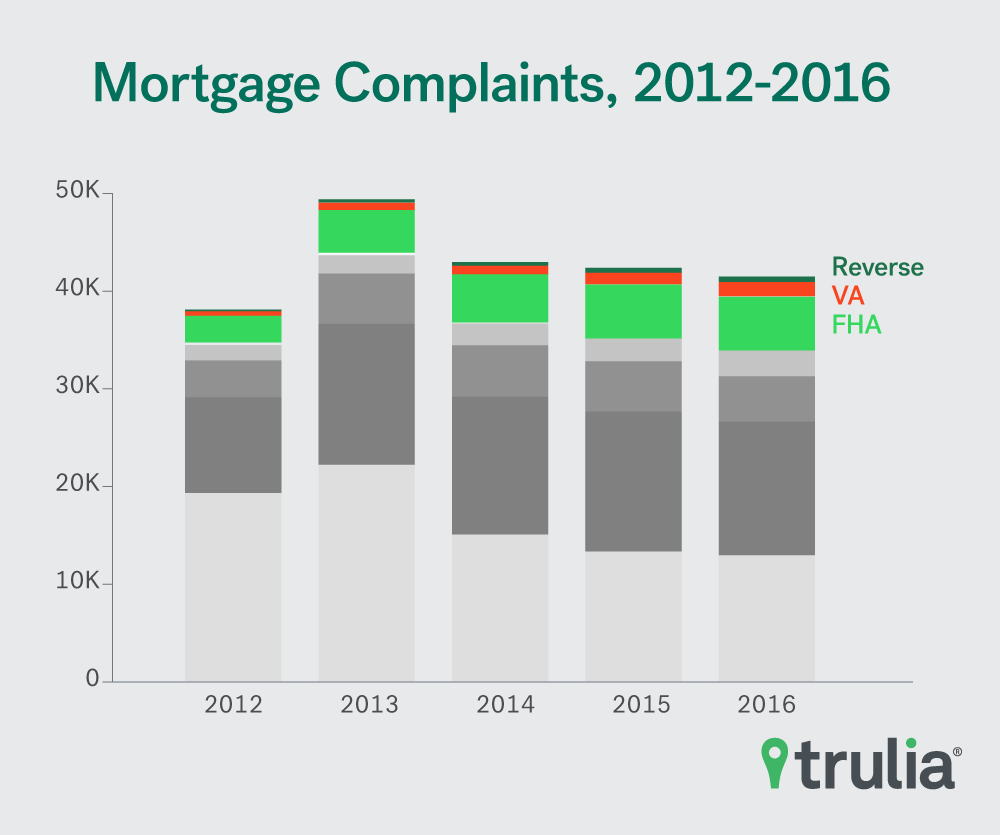
- Disputes about FHA, VA and reverse mortgages have more than doubled since 2012.
- Older Americans (62 and older) and military service members combined make up 15% of all complaints. Broken down, service members made 5% of the complaints, while Americans aged 62 or older made up roughly 10% of all complaints. That’s a high rate given just 35% of seniors who own a home have a mortgage[1].
[1] 2011 CFPB

Expensive and Hard-Hit Markets Lean Most on CFPB
Home borrowers in housing markets hardest hit by the mortgage crisis were more likely to contact the CFPB for aid in dealing with their home loans. Many of these are well known as places where home prices collapsed and foreclosures spiked during the last decade: Miami, Fort Myers, Fla., and Ft. Lauderdale, Fla., among them.
But complaint rates were high in expensive markets too. ZIP codes in San Francisco saw complaint rates of 0.73% of all mortgages held there – nearly twice the national rate (0.46%). Washington, D.C. zip codes had complaint rates of 1.29%, and three New York metro areas by ZIP code ranked among the top 10 nationwide: New Rochelle, Far Rockaway and New York City.
Note: we did not rank zip codes where there are fewer than 1,000 mortgages.
Top Areas For Mortgage Complaints at CFPB
| Three Digit Zip Code | Nearest Major City | Mortgage Complaints | Mortgages | Complaint Rate |
| 331 | Miami, FL | 3,617 | 225,734 | 1.60% |
| 288 | Asheville, NC | 281 | 18,404 | 1.53% |
| 303 | Atlanta, GA | 1,866 | 127,993 | 1.46% |
| 207 | Bowie, MD | 2,543 | 176,636 | 1.44% |
| 330 | Fort Myers, FL | 3,047 | 226,427 | 1.35% |
| 200 | Washington, DC | 1,126 | 86,995 | 1.29% |
| 108 | New Rochelle, NY | 132 | 10,540 | 1.25% |
| 116 | Far Rockaway, NY | 112 | 9,137 | 1.23% |
| 214 | Annapolis, MD | 217 | 18,199 | 1.19% |
| 215 | Cumberland, MD | 182 | 15,446 | 1.18% |
| 333 | Ft. Lauderdale, FL | 1,422 | 123,799 | 1.15% |
| 100 | New York, NY | 976 | 85,756 | 1.14% |
VA, FHA and Reverse Mortgage Disputes on the Rise
Since 2012, the first full year that the CFPB handled disputes, complaints for VA, FHA and reverse mortgages have seen some of the sharpest increases, more than doubling in the first four years between 2012 and 2016. That compares with a 10% increase for all mortgage complaints during the same period. :
- VA mortgage disputes rose 187% to 1,421 from 495.
- FHA mortgage disputes rose 102% to 5,478 from 2,707
- Reverse mortgage disputes rose 172% to 562 from 206.
High dispute rates for these types of loans aren’t surprising. VA and FHA loans and reverse mortgages are most often to at risk and could benefit from a intermediary: veterans, low-income and older borrowers. These loans are also specialized products –that many lenders and servicers don’t have the expertise to handle, according to Erin Lantz, Trulia’s vice president for mortgages.

Annual Complaints by Home Loan Type at CFPB
| Year | Conventional 30-year loan | FHA mortgage | VA mortgage | Adjustable-rate mortgage | Other home loan | Reverse mortgage | Home equity | 2nd mortgage | Total |
| 2011 (Dec.) | 477 | 118 | 19 | 209 | 390 | 8 | 58
|
1 | 1,280 |
| 2012 | 9,808 | 2,707 | 495 | 3,778 | 19,333 | 206 | 1,507 | 290 | 38,124 |
| 2013 | 14,424 | 4,360 | 771 | 5,133 | 22,228 | 309 | 1,930 | 253 | 49,408 |
| 2014 | 14,118 | 4,896 | 877 | 5,271 | 15,072 | 374 | 2,241 | 117 | 42,966 |
| 2015 | 14,339 | 5,505 | 1,171 | 5,133 | 13,330 | 491 | 2,405 | 0 | 42,374 |
| 2016 | 13,709 | 5,478 | 1,421 | 4,638 | 12,497 | 562 | 2,729 | 0 | 41,034 |
| 2017 | 3,015 | 1,313 | 359 | 987 | 2,761 | 138 | 591 | 0 | 9,164 |
Older Americans and Service Members Have an Outsized Share of Complaints
Service members, which include active and reserve members of the military hold only 0.2% of the nation’s mortgages but have made 5% or 11,245, of all home loan complaints.
Likewise what the CFPB calls “older Americans,” made 10% of all complaints. By one measure, that’s fewer complaints than one would expect. Americans 62 years old or older hold 21.7% of all home loans. But for those just five years older that number falls to just over 10%.
In general, older Americans, are more likely to have paid off their home and be mortgage free than their younger home-owning counterparts. By the time most Americans turn 65, roughly 80% of own their own home and just 35.8% of them have a mortgage, according the U.S. Census Bureau. By contrast, 83.8% of those 45-54 years of age, who own a home have a mortgage.
Methodology
Complaint data comes from the Consumer Financial Protection Bureau. Data is from Dec. 1, 2011 through April 10, 2017. The CFPB defines “service member” as active-duty, Reserve and National Guard military members.
For the interactive map, we merged that data using 3-digit U.S. postal codes and mortgage data from the U.S. Census Bureau’s 5-year American Community Survey for 2015.


