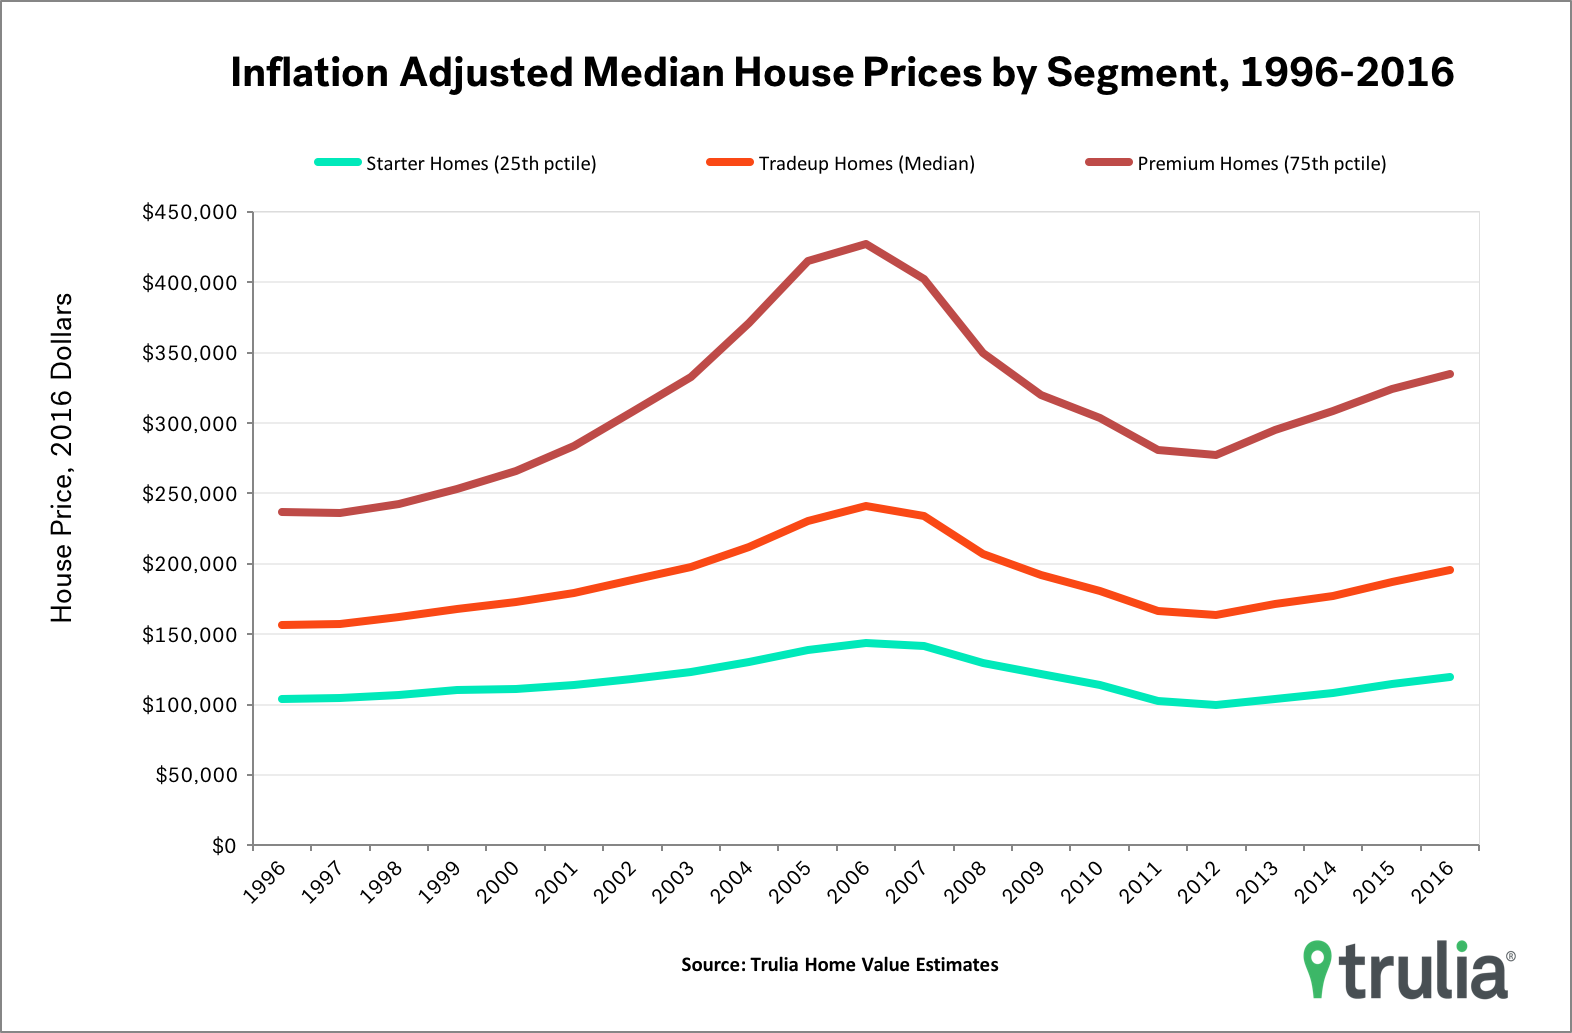
- The National Case-Shiller Home Price Index surpassed its pre-recession peak in September, but crossing this threshold is largely symbolic. After controlling for inflation, home prices in the U.S. are still about 20% below the peak.
- Home prices reaching their nominal pre-recession peaks brings mixed news for the housing market.It’s good news for homeowners who are no longer underwater, but not so great news for homebuyers who have seen prices outpace incomes for most of the housing market recovery.
- The housing market recovery has been very uneven across the U.S. When controlling for inflation, markets that have reached their pre-recession peaks are few and almost exclusively in the West and South. And within those markets, it’s mostly high-end homes that have surpassed the peak.
Today’s S&P/Case-Shiller National Home Price Index increased 5.5% year-over-year in September, which is the 53rd consecutive month of positive gains. Home prices is September also crossed their pre-recession peak, but doing so is largely symbolic. This is because after controlling for inflation, median home prices in the U.S. are still about 20% below the peak reached in 2006. That said, home prices reaching their nominal pre-recession peaks brings mixed news for the housing market. It’s good news for homeowners who are no longer underwater, but not so great news for homebuyers who have seen prices outpace incomes for most of the housing market recovery.

Furthermore, the U.S. housing market recovery has been both limited and uneven. Just seven metros – Dallas, Fort Worth, Houston, Denver, Nashville, Pittsburgh, Tulsa, and San Francisco – have seen prices of starter homes, tradeup homes, and premium homes surpass their pre-recession peaks. In addition, only two markets outside of the West or South have seen recovery at all from their pre-recession peak in any segment: Pittsburgh and Buffalo in both tradeup homes and premium homes. This uneven housing market recovery reflects the nature of the broader economic recovery: job, wage, and population growth has occurred disproportionately in the South and West.
| Metros where Starter Home Prices Have Recovered | Metros where Tradeup Home Prices Have Recovered | Metros where Premium Home Prices Have Recovered | |||
| Metro | % From Peak | Metro | % From Peak | Metro | % From Peak |
| Dallas, TX | 117% | Dallas, TX | 124% | Dallas, TX | 128% |
| Fort Worth, TX | 115% | Denver, CO | 123% | San Jose, CA | 127% |
| Denver, CO | 114% | Fort Worth, TX | 113% | San Francisco, CA | 127% |
| Houston, TX | 106% | San Francisco, CA | 111% | Denver, CO | 121% |
| Nashville, TN | 103% | San Jose, CA | 109% | Houston, TX | 114% |
| Tulsa, OK | 101% | Nashville, TN | 108% | Fort Worth, TX | 109% |
| Pittsburgh, PA | 100% | Houston, TX | 106% | Nashville, TN | 108% |
| Austin, TX | 100% | Pittsburgh, PA | 105% | Pittsburgh, PA | 106% |
| Greenville, SC | 100% | Buffalo, NY | 105% | Buffalo, NY | 106% |
| San Francisco, CA | 100% | Oklahoma City, OK | 104% | Oklahoma City, OK | 104% |
| – | – | Tulsa, OK | 102% | Seattle, WA | 104% |
| – | – | Portland, OR | 101% | Greenville, SC | 102% |
| Raleigh, NC | 101% | Tulsa, OK | 101% | ||
| Colorado Springs, CO | 100% | Portland, OR | 101% | ||
| Note: % from peak calculations are inflation-adjusted to 2016 dollars. Starter homes, tradeup homes, and premium homes are defined as the 25th, 50th, and 75th percentile, respectively, of the Trulia home value distribution. | |||||

