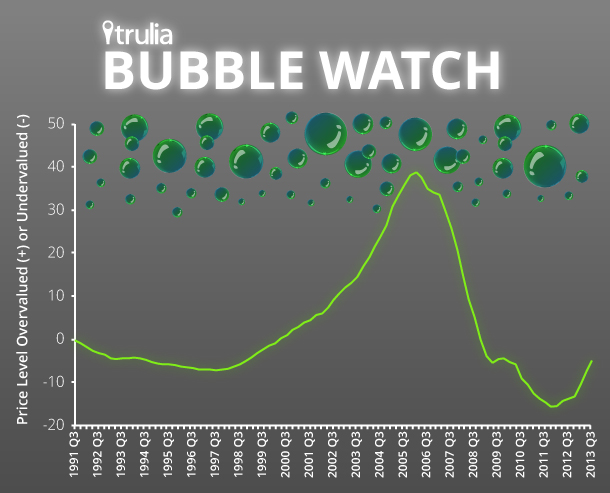
Trulia’s Bubble Watch reveals whether home prices are overvalued or undervalued relative to their fundamental value by comparing prices today with historical prices, incomes, and rents. The more prices are overvalued relative to fundamentals, the closer we are to a housing bubble – and the bigger the risk of a coming price crash.
Our first Bubble Watch report, from May 2013, explains our methodology in detail. We look at the price-to-income ratio, the price-to-rent ratio, and prices relative to their long-term trend, using multiple data sources, including the Trulia Price Monitor as a leading indicator of where home prices are heading. We then combine these various measures of fundamental value rather than relying on a single factor, because no one measure is perfect. Here’s what we found.
Prices are Far From Bubble Levels
We estimate that national home prices are 5% undervalued in the third quarter of 2013 (2013 Q3). During last decade’s housing bubble, prices were as high as 39% overvalued in 2006 Q1, then after the crash fell to 15% undervalued in 2011 Q4. One quarter ago (2013 Q2) prices looked 7% undervalued; one year ago (2012 Q3) prices looked 14% undervalued. This chart shows how far prices are from a bubble:
In the last year, prices have risen faster than rents or income, making them less undervalued per our Bubble Watch measure. But even with prices rising 11% year-over-year according to the Trulia Price Monitor, prices remain 5% undervalued relative to long-term fundamentals.
The Bubbling Local Markets
At the metro level, home prices are below their fundamental value in 81 of the 100 largest metros. Most of the overvalued metros are only slightly so: of the 19 overvalued metros, just two – Orange County and Los Angeles – look at least 10% overvalued. In addition to these two Southern California metros, the most overvalued markets include the three Northern California metros (Oakland, San Jose, and San Francisco), four Texas metros (Austin, San Antonio, Houston, and Dallas), and Honolulu. Among these overvalued metros, prices are now rising fastest in Oakland, at 31% year-over-year. But prices are rising much more slowly in Honolulu, even though prices are as overvalued there as they are in Oakland.
|
The 10 Metros Where Home Prices are Most Overvalued |
|||
| # | U.S. Metro |
Home prices relative to fundamentals, 2013 Q3 |
Y-o-Y change in asking prices, July 2013 |
| 1 | Orange County, CA |
+12% |
23% |
| 2 | Los Angeles, CA |
+10% |
21% |
| 3 | Austin, TX |
+9% |
10% |
| 4 | Oakland, CA |
+7% |
31% |
| 5 | Honolulu, HI |
+7% |
6% |
| 6 | San Jose, CA |
+5% |
21% |
| 7 | San Antonio, TX |
+5% |
12% |
| 8 | Houston, TX |
+5% |
10% |
| 9 | San Francisco, CA |
+4% |
17% |
| 10 | Dallas, TX |
+4% |
13% |
| Note: positive numbers indicate overvalued prices; negative numbers indicate undervalued. Among the 100 largest metros. Click here to see the price valuation for all 100 metros. | |||
Prices are most undervalued today in several Florida and Ohio markets. Detroit and Las Vegas are also among the 10 most undervalued metros, even though prices were up 22% in Detroit and 33% in Las Vegas year-over-year. Prices in Detroit and Las Vegas would have to keep the current pace for several years before getting back into bubble territory.
|
Top 10 Metros Where Home Prices Most Undervalued |
|||
| # | U.S. Metro |
Home prices relative to fundamentals, 2013 Q3 |
Y-o-Y change in asking prices, July 2013 |
| 1 | Palm Bay–Melbourne–Titusville, FL |
-20% |
5% |
| 2 | Cleveland, OH |
-19% |
8% |
| 3 | Akron, OH |
-19% |
3% |
| 4 | Lakeland–Winter Haven, FL |
-18% |
14% |
| 5 | Toledo, OH |
-17% |
6% |
| 6 | Detroit, MI |
-17% |
22% |
| 7 | Dayton, OH |
-17% |
1% |
| 8 | Jacksonville, FL |
-16% |
6% |
| 9 | Las Vegas, NV |
-16% |
33% |
| 10 | Cape Coral–Fort Myers, FL |
-16% |
13% |
| Note: positive numbers indicate overvalued prices; negative numbers indicate undervalued. Among the 100 largest metros. Click here to see the price valuation for all 100 metros. | |||
Veering Away from the Next Bubble
Nationally, home prices have started to slow down even though they haven’t yet become overvalued. The Trulia Price Monitor showed asking prices declined in July 2013, month-over-month, and are decelerating on a quarter-over-quarter basis. This price slowdown boosts the chances of avoiding a housing bubble in the next few years. If price gains fall back in line with the current modest increases in incomes and rents, prices would stay close to their fundamental long-term value and wouldn’t get too overheated. The three factors that are contributing to the price slowdown – expanding inventory, rising mortgage rates, and fading investor interest – aren’t going away any time soon, which should put a cap on how much prices rise. Even though prices look less undervalued than last quarter or last year, the price slowdown means our chances of avoiding the next housing bubble just got better.


