
For nearly a decade, home buyers across the nation have been up against low inventory and eroding affordability. Combined with persistently high prices and rising mortgage rates, buyers are increasingly wary about jumping into the market.
However, signals of a market slowdown may spell good news for some would-be buyers biding their time in pockets of the Bay Area, which has long made other hot markets look tepid by comparison.
We took a granular look at the nine counties that make up the Bay Area (Alameda, Contra Costa, Marin, Napa, San Francisco, San Mateo, Santa Clara, Solano, Sonoma) to gauge which areas are getting hotter and which show signs of a cooldown. We found that:
- Traditionally lower-priced enclaves like East Palo Alto and North Fair Oaks on the Peninsula are seeing the fastest home value growth, rising more than 25 percent year-over-year. Despite that growth, homes there remain far less pricey than those in nearby Atherton and Palo Alto.
- Homes in the North Bay (Marin and Solano counties) aren’t selling as fast as homes in other parts of the Bay Area and could offer opportunities for buyers: Metros across the North Bay have the longest days on market, up to 62 days in Napa compared to just 40 days in San Francisco.
- Many metros across the Bay Area are seeing net out-migration, and with less demand, we may see prices softening. While in hotter markets like San Jose, out-migration hasn’t been enough to tip the scales, the North Bay metros of Napa and San Rafael lost population over the last year. This could spell even greater buyer opportunities in these areas.
- Even in the most expensive markets, we find pockets of significant market cooling: Several neighborhoods in San Francisco show marked increases in days on market and price cuts, accompanied by slowed price appreciation.
Hot and Getting Hotter
Home values across the nation have rebounded well past pre-recession highs, and at the epicenter of this price appreciation is San Francisco and nearby San Jose and Oakland. These metros have the highest median home values in the country, at $1.39 million, $1.29 million and $766,866, respectively – well above other housing markets considered “hot.” In comparison, Los Angeles and New York metros have median home values of $612,809 and $449,229, respectively. San Francisco is also the metro with the shortest median days on market – just 40 days from list to sale – followed by Oakland at 45 days and San Jose at 46 days.
Runaway price appreciation is plaguing cheaper enclaves that border some of the most expensive and affluent cities in the Bay: North Fair Oaks and East Palo Alto, both in San Mateo County, logged the highest home value appreciation in the Bay Area over the past year, at 31.9 percent and 25.2 percent, respectively. That’s about double the 14.4 percent price appreciation for home values in San Mateo County as a whole. Both cities surged past the million-dollar mark over the last year: North Fair Oaks is now valued at $1.24 million and East Palo Alto at $1.01 million. These cities, which have household incomes lower than the county median and are home to predominantly non-white populations, will feel particular strain from these skyrocketing home values.
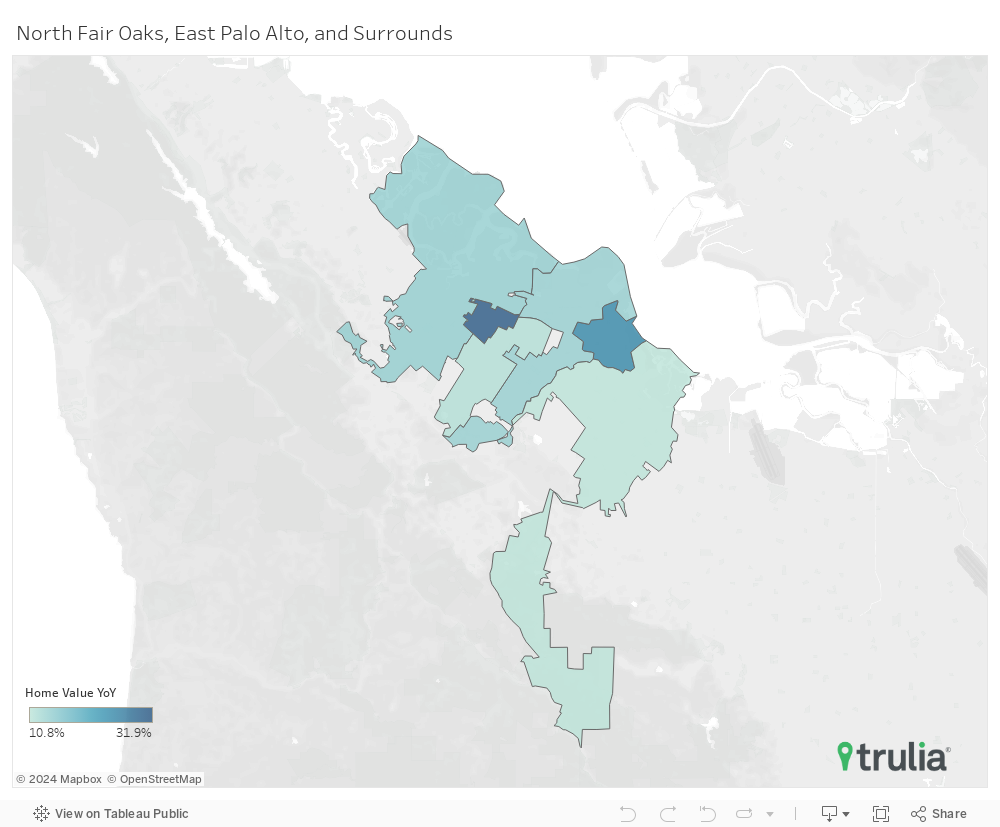
These two towns are bordered by cities that are considerably pricier and wealthier. Atherton bounds North Fair Oaks to the south and east, with the highest home values in the country at a median $6.96 million. Just a few miles away, Palo Alto weighs in at $3.22 million. This area of the Peninsula is dotted with the some of world’s best-known tech companies, and the high incomes and high demand that accompany them have pushed nearby lower-priced cities into the $1 million range.
Cooling Pockets and Turning Tides
While homes in San Francisco, San Jose and Oakland have become unattainable for many local residents, areas of the North and East Bay have housing markets that look starkly different. Homes in Napa County, valued at $665,000, are worth less than half the homes in San Francisco, while homes in Sonoma, Contra Costa, and Solano counties are even cheaper, at $642,400, $624,700, and $432,200, respectively.
A similar bifurcation exists with the median days on market in the past year. Metros across the North Bay see the longest days on market: a whopping 62 days in Napa and 50.5 days in Vallejo, compared to just 40 in San Francisco. However, all metros in the Bay Area still clock in below the national median of 68 days on market.
Nonetheless, the Bay Area as a whole may be on the verge of a market cooldown.
While the area has experienced booming population growth in the decade since the recession, as of July 2017, that growth is slowing. Vallejo is the only Bay Area metro that has exceeded the national rate of population growth since July 2017, with a 1.2 percent gain compared to 0.7 percent population growth nationally. Napa and San Rafael actually decreased in population by 0.5 percent and 0.2 percent, respectively.
A drop in net migration also indicates a possible slowdown. Until recently, all of the Bay Area metros saw more people moving in than moving out in a post-recession job boom. However, in the last few years net migration has either slowed or reversed. For example, after a decade of positive net migration, more people left than moved in to San Jose from 2016 to 2017. While jobs continue to grow in the area, albeit at a slightly slower pace than years past, the cost of housing is increasingly pushing people away and dissuading those who might otherwise move here for employment opportunities. A decline in net migration could translate into less demand for Bay Area housing and a stabilization – or even a decline – in prices.
Even currently, we can find pockets that are experiencing a distinct market slowdown in the most expensive metros in the nation. We pinpointed the neighborhoods with the largest increase in days on market, and took a look at how their home values have fared recently. The Russian Hill and Telegraph Hill neighborhoods of San Francisco saw their days on market fall about 11 days over the last year, putting these neighborhoods at 56 and 57 days on market, respectively. These neighborhoods also saw slowed price appreciation from 2017 to 2018: the year-over-year growth slowed by 4.8 and 1.9 percentage points, respectively.
| Top 10 Neighborhoods with the Largest Increase in Days on Market | ||||||||
| Days on Market | Home Value | |||||||
| City | Neighborhood | 2017 | 2018 | Increase in Days | 2018 | YoY Change 2017 | YoY Change 2018 | Pct Pt. Change |
| Mill Valley | Cascade Canyon | 74.5 | 97.0 | 22.5 | $1,952,200 | 4.6% | 12.8% | 8.2 |
| Napa | Springwood Estates | 57.0 | 78.8 | 21.8 | $655,800 | 3.8% | 3.5% | -0.4 |
| Napa | Fuller Park | 66.0 | 83.0 | 17.0 | $625,900 | 9.6% | 5.8% | -3.8 |
| Napa | Westwood | 43.5 | 55.0 | 11.5 | $486,600 | 9.4% | 5.3% | -4.1 |
| San Francisco | Russian Hill | 45.3 | 55.8 | 10.5 | $1,697,800 | 3.3% | -1.5% | -4.8 |
| San Francisco | Telegraph Hill | 46.0 | 56.5 | 10.5 | $1,267,600 | 4.2% | 2.3% | -1.9 |
| Richmond | Hilltop Green | 49.3 | 59.5 | 10.3 | $524,100 | 8.7% | 8.7% | 0.1 |
| Los Altos | Loyola | 41.0 | 51.0 | 10.0 | $3,752,800 | 12.3% | 9.8% | -2.5 |
| Richmond | Coronado | 59.0 | 66.5 | 7.5 | $379,000 | 17.9% | 11.1% | -6.8 |
| Hayward | Upper B Street | 46.0 | 53.0 | 7.0 | $625,900 | 10.2% | 12.6% | 2.4 |
Note: Of neighborhoods within Bay Area metros. Days on market based on median for the 12 months ending in September of each year. Home values for the month of September in each year.
Price cuts also indicate slowing in some areas. The neighborhoods of Glenwood in San Rafael and Anza Vista in San Francisco, both with home values over $1.2 million, saw some of the biggest jumps in the share of listings with a price cut over the past year. Glenwood saw a 12.7 percentage point rise in price cuts to 17.3 percent in 2018, while price cuts in Anza Vista rose 16.5 percentage points to 21.6 percent– making it the San Francisco neighborhood with the second-largest share of price cuts, just behind Chinatown. Both neighborhoods also experienced a slowdown in price appreciation in the last year of 3.8 and 8.9 percentage points, respectively.
| Top 10 Neighborhoods with the Largest Increase in Price Cuts | ||||||||
| Share of Listings with Price Cuts | Home Value | |||||||
| City | Neighborhood | 2017 | 2018 | Pct Pt. Change | 2018 | YoY Change 2017 | YoY Change 2018 | Pct Pt. Change |
| Richmond | Southwest Annex | 4.9% | 28.0% | 23.1 | $561,700 | -4.0% | 7.3% | 11.3 |
| Napa | Sheveland Ranch | 6.1% | 24.6% | 18.4 | $523,600 | 10.7% | 0.5% | -10.2 |
| Oakland | Rancho San Antonio | 2.2% | 17.4% | 15.2 | $578,900 | N/A | N/A | N/A |
| San Rafael | Glenwood | 4.7% | 17.3% | 12.7 | $1,254,500 | 4.9% | 1.1% | -3.8 |
| Oakland | Toler Heights | 2.2% | 14.7% | 12.5 | $583,400 | 12.7% | 11.3% | -1.3 |
| Richmond | Atchison Village | 7.7% | 19.2% | 11.5 | $241,500 | N/A | N/A | N/A |
| San Francisco | Anza Vista | 7.1% | 18.4% | 11.3 | $1,352,300 | 14.0% | 5.2% | -8.9 |
| Napa | Shurtleff | 12.6% | 23.8% | 11.2 | $520,000 | 11.7% | 1.1% | -10.6 |
| Richmond | Santa Fe | 1.6% | 11.6% | 10.0 | $372,300 | N/A | N/A | N/A |
| Cupertino | North Blaney | 2.7% | 12.5% | 9.8 | $2,374,400 | 10.9% | 18.5% | 7.5 |
Note: Of neighborhoods within Bay Area metros. Price cuts based on listings throughout the 12 months ending in September of each year. Home values for the month of September in each year. Some neighborhood home values unavailable due to data constraints.
While the Bay Area is still far from affordable, these hints of a cooler market on the horizon may soon have homebuyers breathing easier. And with large variation in market trends across neighborhoods, you might find what you’re looking for just a few doors over.
Methodology
2016 5-year ACS data used for median household income figures. Days on market and price reduction data only include neighborhoods with at least 24 listings across the year. Census Vintage 2017 county population totals used for population and net-migration figures.

