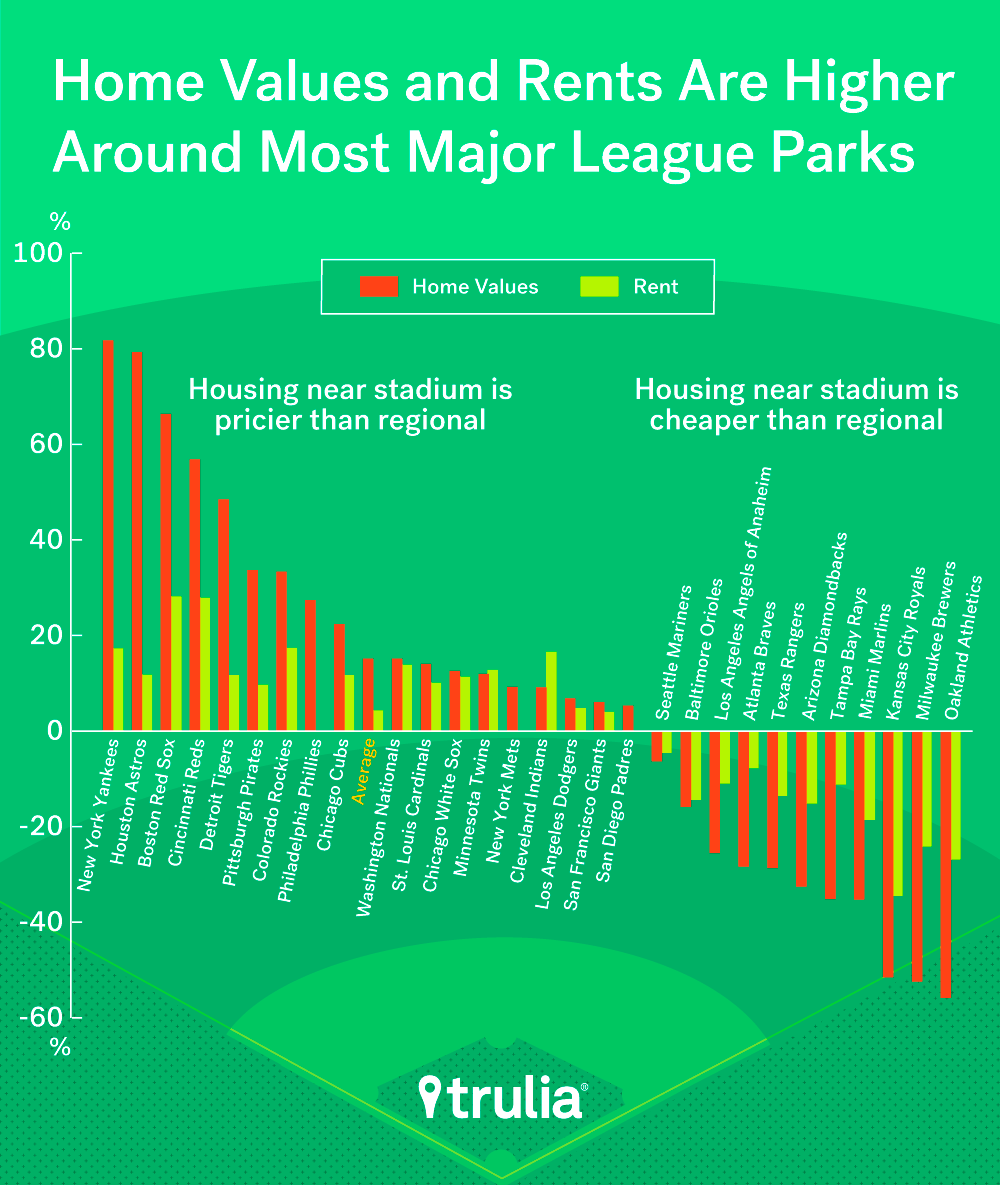
The neighborhoods around major league baseball stadiums tend to have higher home values than the greater metro areas surrounding them, but those values vary widely based on stadium location.
Having a major league baseball team as a next-door neighbor requires a special kind of host. More than 73.7 million people attended regular season games last year, an average of 30,366 a game.
We took a look at homes within a mile of U.S. MLB parks (we excluded Toronto) to gauge how well baseball had made itself at home. We found that the areas around 18 of the 29 stadiums had higher median home values compared to the cities in which they resided. We also found that rents in those 18 neighborhoods were either higher or equal to those in the surrounding towns.
Newer stadiums also tend to be located in pricier neighborhoods. Of the 14 stadiums built since 1999, only two neighborhoods – around Marlins Park in Miami and Miller Park in Milwaukee – had home values lower than the metros in which they were located. Rents were higher in those neighborhoods too, except for those around Miller and Marlins parks.
When it came to older stadiums home values were more split. Of the 11 stadiums built in, or before, 1999, six had home values and rents at or above the median market rate.
- Overall, the areas around MLB stadiums had home values 15% higher than the greater metros in which they were located. Rents varied widely, but taken as a whole were roughly in line with local markets.
- The Kansas City Royals, the reigning World Series champions, may be the kings when it comes to the game, but the neighborhood around Kauffman Stadium is affordable for paupers. It ranks among the least expensive for rents, 52.4% lower, and home values, 51.6% lower, relative to the Kansas City metro area.
- Bronx Bombers: Yankee Stadium’s close proximity to the tony Upper East Side helped its neighborhood home values rank 81.7% higher than the New York City metro area.
- The neighborhoods around O.co Coliseum, the home of the Oakland Athletics, are among the least expensive in the East Bay, while rents and home values near AT&T Park in San Francisco are roughly in line with the rest of the Bay Area. It’s also the most expensive neighborhood to live within walking distance of an MLB park.
- Old time baseball: Fenway Park and Wrigley Field, the oldest major league ballparks respectively, are premium destinations for renters and home buyers. Both ranked in the top 10 with rents and home values above the medians for their cities, Boston and Chicago,
Top of the Order: Where Home Values Are Higher
Urban or downtown stadiums tend to have higher values than surrounding metro areas. Newer stadiums including Citizens Bank Park in Philadelphia and Nationals Park in Washington made the top 10, but older stadiums with thriving neighborhoods such as Kenmore Square and Back Bay Fens around Fenway Park in Boston and Wrigleyville in Chicago also carried higher values as measured by home values.

| Where Home Values Are Highest Around MLB Stadiums | ||||||
| Team Name | Name of Stadium | Metro Location | Year Opened | Median Metro Home Value | Median Home Value Near Stadiums | % Stadium Home Value vs. Metro Home Value |
| New York Yankees | Yankee Stadium | New York, NY | 2009 | $407,379 | $740,106 | 81.7% |
| Houston Astros | Minute Maid Park | Houston, TX | 2000 | $171,162 | $306,686 | 79.2% |
| Boston Red Sox | Fenway Park | Boston, MA | 1912 | $395,937 | $658,396 | 66.3% |
| Cincinnati Reds | Great American Ball Park | Cincinnati, OH | 2003 | $144,210 | $226,140 | 56.8% |
| Detroit Tigers | Comerica Park | Detroit, MI | 2000 | $62,101 | $92,145 | 48.4% |
| Pittsburgh Pirates | PNC Park | Pittsburgh, PA | 2001 | $131,293 | $175,461 | 33.6% |
| Colorado Rockies | Coors Field | Denver, CO | 1995 | $329,568 | $439,351 | 33.3% |
| Philadelphia Phillies | Citizens Bank Park | Philadelphia, PA | 2004 | $138,670 | $176,572 | 27.3% |
| Chicago Cubs | Wrigley Field | Chicago, IL | 1914 | $208,939 | $255,475 | 22.3% |
| Washington Nationals | Nationals Park | Washington, DC | 2008 | $361,061 | $415,434 | 15.1% |
Bottom of the order: Older Stadiums and Unfriendly Locations
Home values tended to be lower around stadiums that were built more than 20 years ago – six of the bottom 10 were built before 1996 — including Kauffman Stadium in Kansas City, Mo., and O.co Stadium in Oakland, Calif. Other lower home values were found around stadiums in industrial areas or, in the case of Miller Park in Milwaukee, a lot of traffic from interstate highways.
| Where Home Values Are Lowest Around MLB Stadiums | ||||||
| Team Name | Name of Stadium | Metro Location | Year Opened | Median Metro Value | Median Home Values Near Stadiums | % Stadium Home Value vs. Metro Home Value |
| Oakland Athletics | O.co Coliseum | Oakland, CA | 1966 | $633,640 | $279,518 | -55.9% |
| Milwaukee Brewers | Miller Park | Milwaukee, WI | 2001 | $196,675 | $93,370 | -52.5% |
| Kansas City Royals | Kauffman Stadium | Kansas City, MO | 1973 | $147,202 | $71,253 | -51.6% |
| Miami Marlins | Marlins Park | Miami, FL | 2012 | $250,767 | $162,267 | -35.3% |
| Tampa Bay Rays | Tropicana Field | Tampa, FL | 1990 | $164,206 | $106,462 | -35.2% |
| Arizona Diamondbacks | Chase Field | Phoenix, AZ | 1998 | $217,414 | $146,526 | -32.6% |
| Texas Rangers | Globe Life Park in Arlington | Fort Worth, TX | 1994 | $160,751 | $114,658 | -28.7% |
| Atlanta Braves | Turner Field | Atlanta, GA | 1997 | $164,361 | $117,710 | -28.4% |
| Los Angeles Angels of Anaheim | Angel Stadium of Anaheim | Orange County, CA | 1966 | $642,602 | $477,900 | -25.6% |
| Baltimore Orioles | Camden Yards | Baltimore, MA | 1992 | $251,619 | $211,724 | -15.9% |
Stealing Home: Where Rents Are Cheaper Near MLB Parks
Not surprisingly, it was cheaper to rent near stadiums where home values were lower. Rentals in Kansas City, Oakland, Calif., and Milwaukee were at least 20% below the greater market rate. Surprisingly, newer or renowned stadiums such as Marlins Park in Miami, built in 2012 and Baltimore’s Camden Yards, which became a model for parks built after 1992, were surrounded by neighborhoods with relatively lower rents.
| Where Rents Are Cheapest Around MLB Stadiums | ||||||
| Team Name | Name of Stadium | Metro Location | Year Opened | Median Metro Rent | Median Rent Near Stadium | % Stadium Rent vs. Metro Rents |
| Kansas City Royals | Kauffman Stadium | Kansas City, MO | 1973 | $1,295 | $850 | -34.4% |
| Oakland Athletics | O.co Coliseum | Oakland, CA | 1966 | $2,800 | $2,050 | -26.8% |
| Milwaukee Brewers | Miller Park | Milwaukee, WI | 2001 | $1,450 | $1,100 | -24.1% |
| Miami Marlins | Marlins Park | Miami, FL | 2012 | $1,995 | $1,625 | -18.5% |
| Arizona Diamondbacks | Chase Field | Phoenix, AZ | 1998 | $1,295 | $1,100 | -15.1% |
| Baltimore Orioles | Camden Yards | Baltimore, MD | 1992 | $1,750 | $1,500 | -14.3% |
| Texas Rangers | Globe Life Park in Arlington | Fort Worth, TX | 1994 | $1,445 | $1,250 | -13.5% |
| Tampa Bay Rays | Tropicana Field | Tampa, FL | 1990 | $1,350 | $1,200 | -11.1% |
| Los Angeles Angels of Anaheim | Angel Stadium of Anaheim | Orange County, CA | 1966 | $2,800 | $2,495 | -10.9% |
| Atlanta Braves | Turner Field | Atlanta, GA | 1997 | $1,300 | $1,200 | -7.7% |
Juiced Rents: Where It Costs More to Rent Near A Ballpark
Not all of the places where ballpark home values were low had lower rents. In Cleveland, for instance, rents were 16.7% higher than the greater market, but home values were just 9.2% higher. Conversely, Detroit rents are 11.8% higher near Comerica Park, but home values are a whopping 48.4% higher than Detroit metro.
| Where Rents Are Most Expensive Around MLB Stadiums | ||||||
| Team Name | Name of Stadium | Metro Location | Year Opened | Median Metro Rent | Median Rent Near Stadium | % Stadium Rent vs. Metro Rents |
| Houston Astros | Minute Maid Park | Houston, TX | 2000 | $1,600 | $2,100 | 31.3% |
| Boston Red Sox | Fenway Park | Boston, MA | 1912 | $2,300 | $2,950 | 28.3% |
| Cincinnati Reds | Great American Ball Park | Cincinnati, OH | 2003 | $1,250 | $1,600 | 28.0% |
| Colorado Rockies | Coors Field | Denver, CO | 1995 | $2,000 | $2,350 | 17.5% |
| New York Yankees | Yankee Stadium | New York, NY | 2009 | $2,300 | $2,700 | 17.4% |
| Cleveland Indians | Progressive Field | Cleveland, OH | 1994 | $1,200 | $1,400 | 16.7% |
| Washington Nationals | Nationals Park | Washington, DC | 2008 | $2,100 | $2,395 | 14.0% |
| Minnesota Twins | Target Field | Minneapolis – St. Paul, MN | 2010 | $1,550 | $1,750 | 12.9% |
| Chicago Cubs | Wrigley Field | Chicago, IL | 1914 | $1,700 | $1,900 | 11.8% |
| Detroit Tigers | Comerica Park | Detroit, MI | 2000 | $850 | $950 | 11.8% |
If you love the game, the cheapest places to live close to a major league team are in the Midwest. Newer stadiums and very, very old stadiums such as Wrigley and Fenway carry a premium to their local markets.
Methodology
To determine whether homes near MLB stadiums are worth more or less than other homes in a metro area, we did a simple comparison of the median home value within a one-mile radius of an MLB stadium on March 1, 2016, to the median home value of homes in the metropolitan outside the 1-mile radius.


