
A home is the costliest purchase most households will ever make, and it’s understandable to want to find the best bargain possible. This often leads to lots of leg work for diligent buyers – but sometimes, sellers do the work for buyers and advertise up front what a good deal their home is (or at least what a good deal they think it is).
We combed through the listing descriptions of all homes listed in the past year to see which ones were being described as a “bargain,” “deal,” or similar, and whether they were actually a good deal. To qualify as a true bargain, homes had to be listed at a price below their estimated value. As with most things in life, we found that some “deals” were too good to be true.
We found that:
- In more than a third (35) of the nation’s largest 100 housing markets, homes listed for sale with the term “bargain” (or similar) in their description are actually no bargain at all, or are offered for even more than their estimated value.
- Camden, N.J., Bridgeport, Conn., and Lake County, Ill. saw the largest share of listings advertised as a bargain, at 7.1 percent, 6.7 percent, and 6.1 percent respectively. However, areas with the most advertised bargains didn’t necessarily see the most underpriced listings.
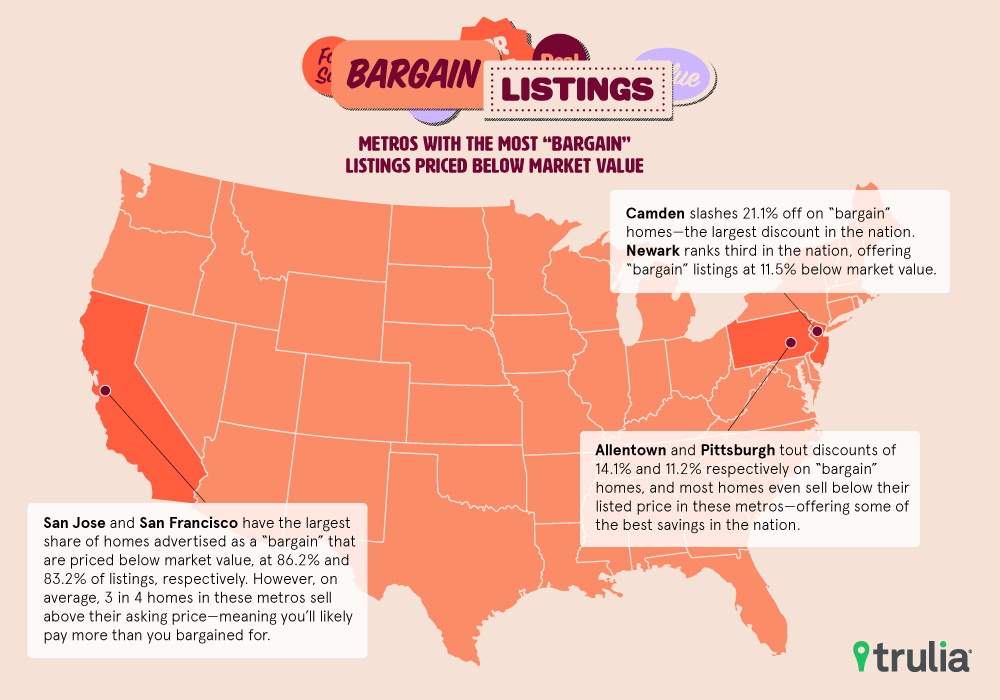
- San Jose, Calif., San Francisco, Calif., and Camden, N.J. had the most listings advertised as “bargains” that were actually priced below the home’s estimated value, at 86.2 percent, 83.2 percent, and 78.8 percent of “bargain” listings, respectively. Camden has the additional distinction of seeing the largest discount on these “bargain” homes – listed at 21.1% lower than the home’s value on average.
- While these pricey Bay Area metros appear to have a sizeable share of deals on the market, they also see the most homes sold above asking. So, that discount on a “bargain” home in San Francisco or San Jose may actually end up costing more than you bargained for.
Where are the Bargains?
Home bargains aren’t so easy to find – most listings won’t advertise the home as a good deal. Even in metros with the highest share of listings advertised as bargains, those listings are few and far between. Camden, N.J., Bridgeport, Conn., and Lake County, Ill. each saw about 6 to 7 percent of all listings advertised as bargains, the highest rates in the nation.
| Metros with the Most “Bargain” Listings | |||||
| Metro | % of Listings Advertised as “Bargains” | % of “Bargain” Listings Priced Lower than Value | % Difference Listing Price vs Value for “Bargains” | ||
| Camden, NJ | 7.1% | 78.8% | -21.1% | ||
| Bridgeport, CT | 6.7% | 56.6% | -2.7% | ||
| Lake County, IL | 6.1% | 71.1% | -9.3% | ||
| Cape Coral, FL | 5.8% | 36.5% | 3.1% | ||
| Tucson, AZ | 5.5% | 64.6% | -1.1% | ||
| North Port-Sarasota, FL | 5.0% | 42.2% | 3.4% | ||
| Hartford, CT | 4.8% | 42.4% | -1.0% | ||
| Philadelphia, PA | 4.7% | 58.2% | -4.7% | ||
| Newark, NJ | 4.6% | 77.7% | -11.5% | ||
| Phoenix, AZ | 4.5% | 53.1% | 1.1% | ||
What’s more, not all listings advertised as a bargain actually offer a discount on that home. Camden has the highest discount in the nation – homes advertised as bargains are priced, on average, 21.1 percent below their estimated value. But listings described as a good deal in Cape Coral, Fla., are actually priced 3.1 percent higher on average than the home’s value—only 36.5 percent of homes listed as a “bargain” in this metro are actually priced at a discount relative to their estimated value.
But…Where is a “Bargain” Actually a Bargain?
On the other hand, in San Jose, Calif., San Francisco, Calif., and Camden, N.J, the vast majority of bargain bin homes are actually offered at a discount – 86.2 percent, 83.2 percent, and 78.8 percent of properties described as a bargain in these areas, respectively, are priced below the estimated value of that home. But pickings are slim in San Francisco and San Jose – just 2.3 percent and 1.7 percent of all listings, respectively, are described as a bargain – perhaps no surprise for the priciest metros in the nation.
| Metros with the Most “Bargain” Listings Priced Below Market Value | |||||
| Metro | Bargain Listings | All Transactions | |||
| % Priced Below Value | Avg % Discount | Avg $ Discount | % Homes Selling Above Asking | Avg % Difference Sales Price vs. Listing Price | |
| San Jose, CA | 86.2% | -9.5% | -$164,624 | 74.6% | 8.5% |
| San Francisco, CA | 83.2% | -10.5% | -$151,159 | 76.5% | 11.0% |
| Camden, NJ | 78.8% | -21.1% | -$43,443 | 16.4% | -6.9% |
| Newark, NJ | 77.7% | -11.5% | -$46,016 | 25.2% | -4.1% |
| Pittsburgh, PA | 74.0% | -11.2% | -$8,984 | 15.8% | -7.1% |
| Allentown, PA | 72.0% | -14.1% | -$28,504 | 20.2% | -5.0% |
| Portland, OR | 71.8% | -3.8% | -$17,754 | 34.2% | -1.6% |
| Lake County, IL | 71.1% | -9.3% | -$33,903 | 15.5% | -6.1% |
| Seattle, WA | 70.1% | -3.9% | -$20,038 | 50.0% | 2.1% |
| Dayton, OH | 69.5% | -9.0% | -$9,481 | 20.2% | -4.8% |
| Note: Average discount on bargain listings based only on listings priced below estimated value. Percentage of homes selling above asking and average difference in sales vs listing prices based on all transactions in the last year. | |||||
Among the metros with the highest share of discounted “bargain” homes, San Francisco, San Jose, and Seattle are outliers in a list otherwise populated with generally cheaper, slower housing markets. While it makes sense for sellers in slow markets to slash prices in hopes of bringing more prospective buyers in the door, what are pricey West Coast metros doing with bargain bin prices?
There are a lot of factors that go into determining the initial listing price of a home when it hits the market, and strategies can vary greatly depending on geographic and local economic factors. It’s likely that in typically faster-moving, more-expensive West Coast markets, some sellers may intentionally advertise a low offering price in order to stand out or attract more attention from buyers, understanding or expecting that homes typically sell for above asking price anyway.
And in fact, home bargains in San Francisco, San Jose and Seattle may be too good to be true. In these metros, more often than not, homes are sold above their asking price. About 3 in 4 homes sold in the last year in the Bay Area metros—76.5 percent of homes in San Francisco and 74.6 percent in San Jose—ended up selling for more than their original listing price. Exactly half (50 percent) of homes in Seattle sold above asking. ln markets where over-asking bids are the expectation, not the exception, a lower listing price at the beginning may not mean an actual deal in the end.
So while homes advertised as a “bargain” in San Francisco are listed at a 10.5 percent discount from market value, on average, properties in the metro sell for 11.0 percent over their listing price. Similarly, in San Jose, the bargain listed discount is 9.5 percent—but on average, homes also close at 8.5 percent over ask. Meanwhile in Seattle, that scant 3.9 percent discount on bargain listings may look even smaller, because homes in that area will typically sell for 2.1 percent over the original listing price.
Much like Black Friday discounts, listings touting bargains and deals may help bring prospective shoppers in the door. But also like Black Friday, once in the door, you might just end up spending more on that home than you bargained for.
Methodology
We looked at all single-family homes and condos listed for sale on Trulia in the 100 largest U.S. metros from in the 12 months ending in October, and identified which ones were described with the terms “bargain,” “value,” “deal,” “under valued” and “under priced” to determine whether they were being advertised as a bargain. Only metros with at least 50 homes listed as bargains were included in the analysis. We compared the listing price of each home to its estimated home value during the month it was listed to determine the discount.
We looked at transactions that closed in the 12 months ending in October to determine the percentage that were sold above the original listing price, as well as the average difference between sales price and listings price for each metro.

