Last year, we found that Baby Boomers were especially unlikely to live in multi-unit housing. At the same time, we noted that the share of seniors living in multi-unit housing rather than single-family homes has been shrinking for decades. These findings got us thinking about how the generations vary in house-size preference. So we surveyed over 2000 people at the end of last year to figure out if boomers have different house-size preferences than their younger counterparts. And that led us to ask: What size homes do Americans really want?
Most Americans are not living in the size home they want
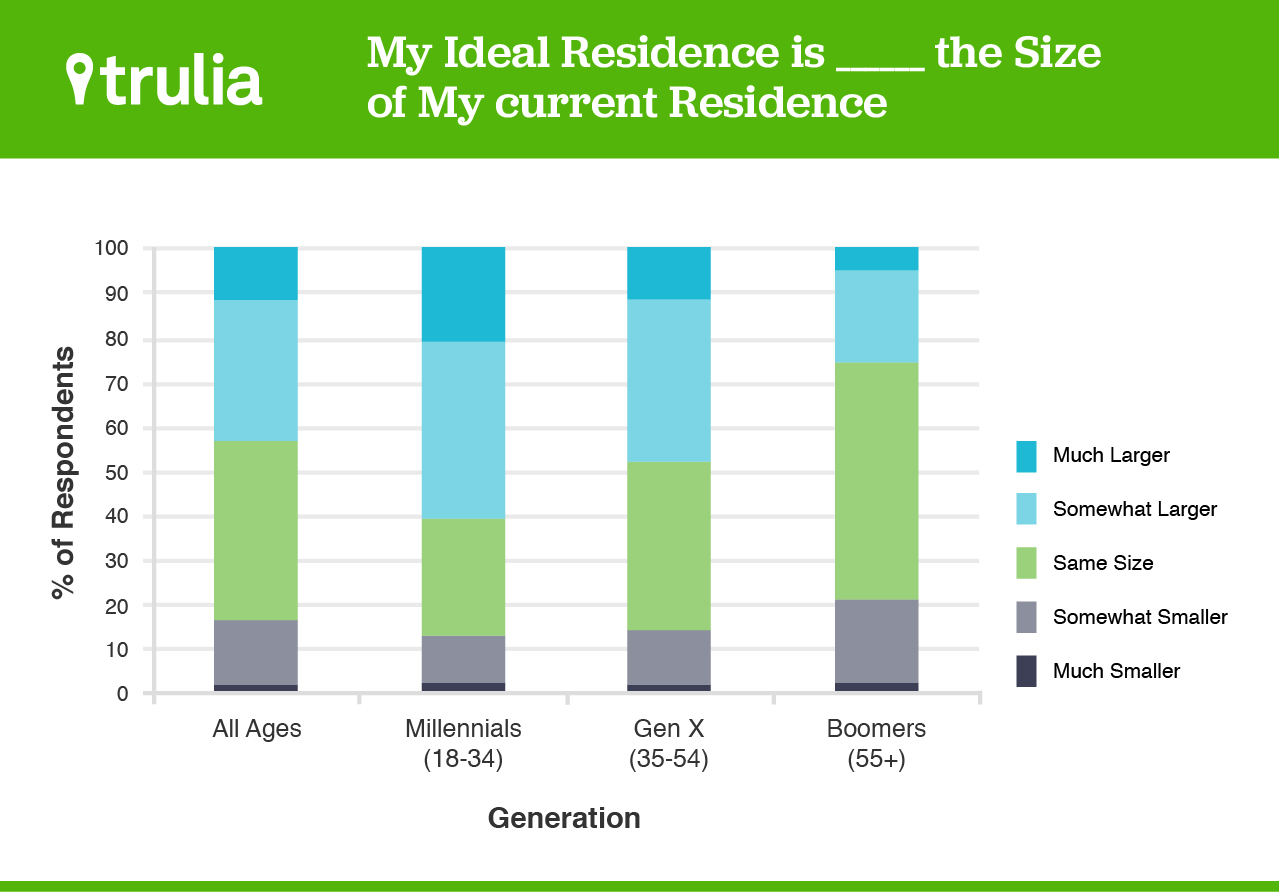
As a whole, Americans are living in a world of mismatch – only 40% of our respondents said they are living in the size home that’s ideal. Furthermore, over 43% answered that the size of their ideal residence is somewhat or much larger than their current digs. Only 16% told us that their ideal residence is smaller than their existing home. However, these overall figures mask what is going on within different generations.
It’s natural to think that baby boomers are the generation most likely to downsize. After all, their nests are emptying and they may move when they retire. As it turns out though, more boomers would prefer to live in a larger home than a smaller one: 21% said their ideal residence is smaller than their current home, while 26% wanted a larger home – a 5-percentage-point difference. Clearly, boomers don’t feel a massive yearn to downsize. On the contrary, just over half (53%) said they’re already living in their ideally sized home. Nonetheless, members of this generation are more likely to want to downsize than millennials and GenXers.
In fact, those younger generations want some elbow room. First, the millennials. They’re looking to move on up by a big margin: just over 60% told us their ideal residence is larger than where they live now – the largest proportion among the generations in our sample. By contrast, only a little over 13% of millennials said they’d rather have a smaller home than their existing one – which is also the smallest among the generations in our sample. The results are clear: millennials are much more likely to want to upsize than downsize.
The next generation up the ladder, the GenXers, are hitting their peak earning years and many in this group may be in a position to trade up. Many aren’t living in their ideally sized home. Just 38% said where they live now is dream sized. Nearly a majority (48%) said their dream home is larger, while only 14% of GenXers would rather have a smaller home. This is the generation that bore the brunt of the foreclosure crisis. So, some of this mismatch could be because a significant number of GenXers lost homes during the housing bust and may now be living in smaller-than-desired quarters. But a much more probable reason is that many GenXers are in their peak child-rearing years. With kids bouncing off the walls, the place may be feeling a tad crowded.
Even the groups that seem ripe for downsizing don’t want smaller homes
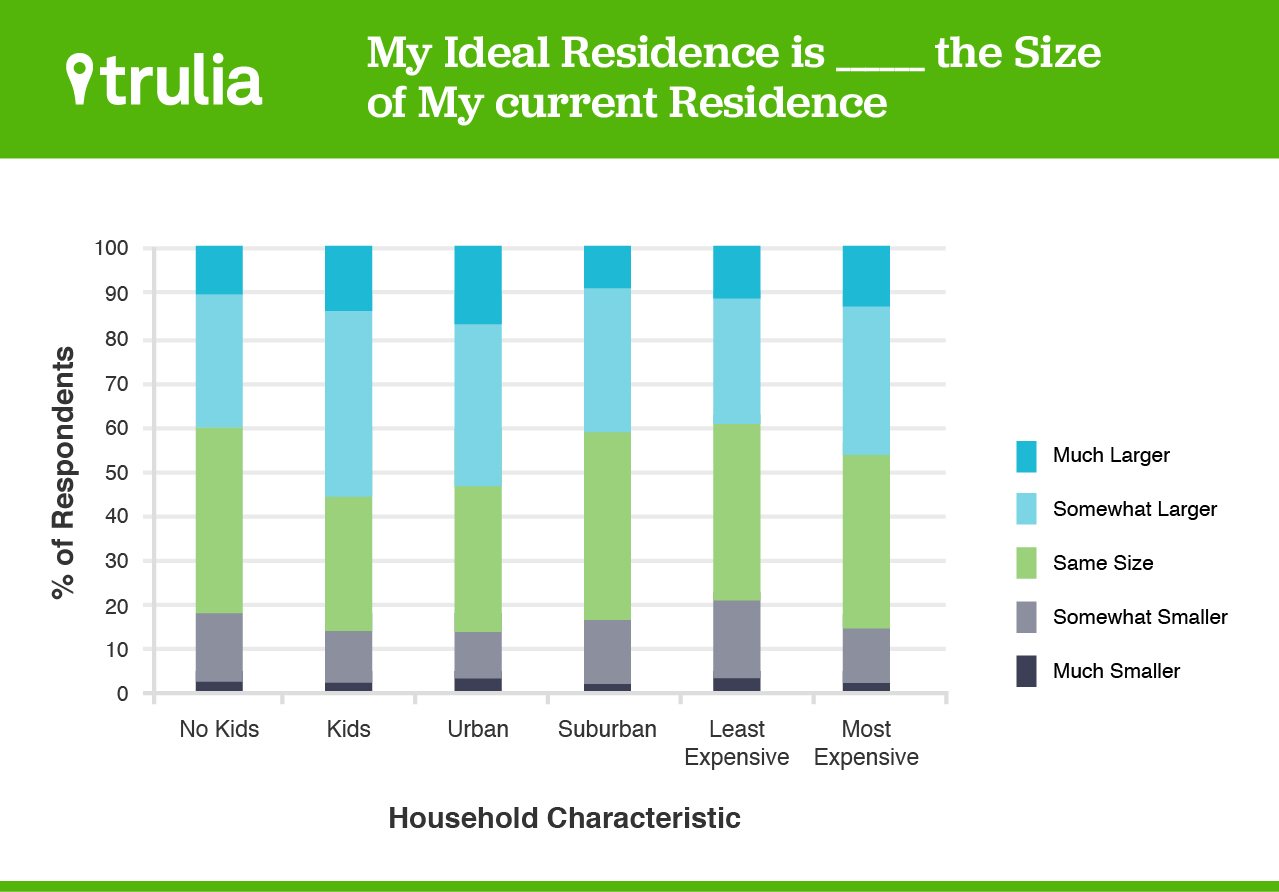
Of course, age doesn’t tell the whole story about why people might want to downsize. It could be that certain kinds of households, – such as those without children, and living in the suburbs or in affordable areas – might be more likely to live in larger homes than they need. But our survey shows that households in these categories are about twice as likely to want a larger than a smaller home. For those with kids especially, the desire to upsize is strong: 39% preferred a larger home versus 18% who liked a smaller home. For those living in the suburbs, the disparity is even greater – 42% to 16%. And even among those living in the most affordable zip codes, where ideally-sized homes might be within the budgets of households, 40% of our respondents preferred larger homes versus 20% who said smaller.
Are all households more likely to upsize than downsize?
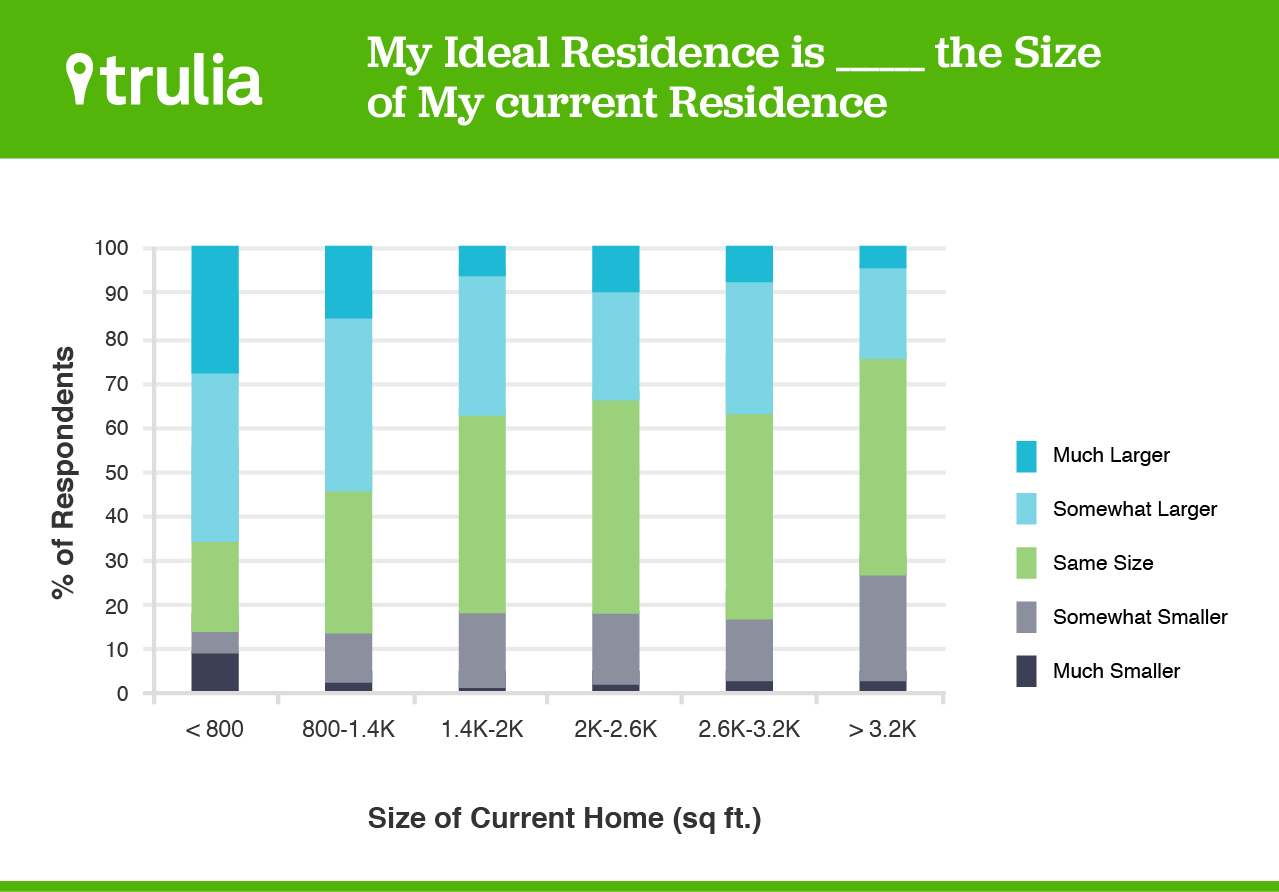
At this point you might be asking, “Are there any types of households that want to downsize?” The answer is yes. But only one kind of household falls into this category – those living in homes larger than 3,200 square feet. Of this group, 26% wanted to downsize versus 25% that wanted to upsize – a slight difference. But, when we looked overall at survey responses based on the size of current residence, households wanting a larger home kicked up as current home size went down. We can see this clearly when we divide households into six groups based on the size of the home they’re living in now. Among households living in 2,600-3,200 square foot homes, 37% prefer a larger home versus 16% a smaller home; in 2,000–2,600 square foot homes, its 34% to 18%; 38% to 18% in 1,400–2,000 square foot homes; 55% to 13% in 800–1,400 square foot homes; and 66% to 13% in homes less than 800 square feet. This makes intuitive sense. Those living in the biggest homes are most likely to have gotten a home larger than their ideal size. And those in the smallest homes are probably the ones feeling most squeezed.
The responses to our survey show significantly more demand for larger homes than for smaller ones. But the reality, of course, is that households must make tradeoffs between things like accessibility, amenities, and affordability when choosing what size homes to get. The “ideal” sized home for most Americans may be larger than where they’re living now. But that spacious dream home may not practical. As result, the mismatch between what Americans say they want and what best suits their circumstances may persist.
Survey Methodology
This survey was conducted online within the United States between November 6-10, 2014 among 2,008 adults (aged 18 and over) by Harris Poll on behalf of Trulia via its Quick Query omnibus product. Figures for age, sex, race/ethnicity, education, region and household income were weighted where necessary to bring them into line with their actual proportions in the population. Propensity score weighting was used to adjust for respondents’ propensity to be online.
All sample surveys and polls, whether or not they use probability sampling, are subject to multiple sources of error which are most often not possible to quantify or estimate, including sampling error, coverage error, error associated with nonresponse, error associated with question wording and response options, and post-survey weighting and adjustments. Therefore, the words “margin of error” are avoided as they are misleading. All that can be calculated are different possible sampling errors with different probabilities for pure, unweighted, random samples with 100% response rates. These are only theoretical because no published polls come close to this ideal.
Respondents for this survey were selected from among those who have agreed to participate in our surveys. The data have been weighted to reflect the composition of the adult population. Because the sample is based on those who agreed to participate in the online panel, no estimates of theoretical sampling error can be calculated.

