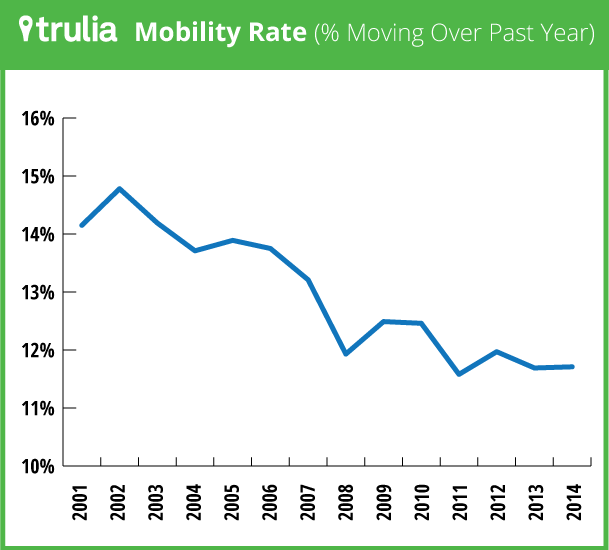
Yesterday, the Census released the Current Population Survey (CPS) data, giving an up-to-date picture on how many Americans are moving, how far they’re going, and why they’re making that move. (See note.) The mobility rate remains at a low level: 11.7% of Americans moved in the year ending March 2014, unchanged from the year ending March 2013.
At this mobility rate, the typical American stays put eight and a half years between moves. Remember the old rule of thumb that people move every seven years? Well, that was true until around 2003. In fact, the mobility rate has been falling for decades, as we pointed out in this post last year. Back in the 1950s and 1960s, Americans moved every five years on average. That rose to every seven years by the turn of the century and has since increased to the current eight-and-a- half year rate.
In today’s post, we look at the 2014 data to highlight the most recent mobility trends.
No Reversal in the Long-Term Mobility Decline
With the percentage of Americans moving stuck at 11.7% in 2014, mobility remains near the all-time low of 11.6% in 2011. That’s considerably below the 14% rate from the early 2000s. The housing bust and recession offer possible explanations why people are stuck in place – things like negative home equity and few job opportunities to move for. Still, mobility also declined both before and during the housing bubble. Furthermore, mobility has barely budged since 2011 despite a significant drop in the percentage of borrowers with negative equity and a modest recovery in the job market.

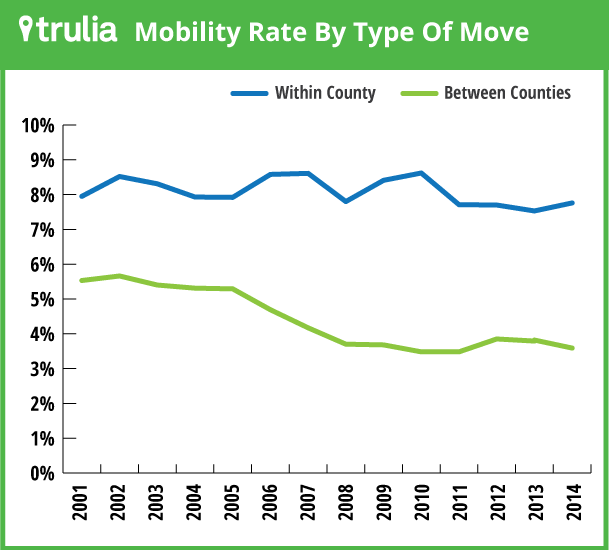
What explains this long-term decline in mobility? Some academic researchers have found that the economic benefit of switching jobs has fallen over time. Since a job is often the reason people move, that means the economic benefits of moving have fallen. In fact, the decline in mobility has mostly been a drop in longer-distance moves, that is, moves to a different county. Moves within the same county have stayed relatively steady since 2000.

Why Americans Move
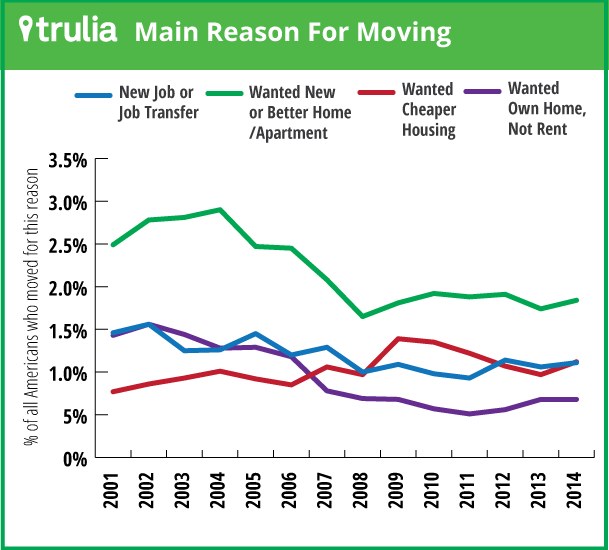
The reasons why Americans move – which we think is one of the most fun questions asked in any Census survey – have changed over the course of the boom, recession, and recovery. During the boom, compared with the period after the bubble burst, more people moved to have a new or better home, or because they wanted to own instead of rent. By contrast, during the recession, the percentage of people who moved for cheaper housing went up.
Most recently, in the year ending March 2014, the percentage of people who moved because they wanted a new or better home or apartment increased. But the percentage of people who moved for cheaper housing also increased, though it didn’t return to its level in 2009, 2010, and 2011, when more people moved for cheaper housing than for a new job.

Continued economic recovery should boost the number of Americans who move for a job. At the same time, more homeowners are getting back above water into positive home equity, and that should also increase mobility. Yet, rising home prices and higher mortgage rates might mean that more people move in search of cheaper, rather than new or better, housing.
Note: this post is based on the Current Population Survey (CPS) 2014 Annual Social and Economic Supplement (ASEC), which was conducted in March 2014. The Census released the raw data Tuesday as well as reports based on these data on income, poverty, and health insurance. Yesterday we released a report on living arrangements, headship, and homeownership based on same Census data set.
Two weeks ago, we analyzed Census data on migration between specific U.S. counties. We found that most U.S. moves are toward counties with lower population density, lower housing costs, and lower unemployment. That analysis was based on the 2008-2012 American Community Survey (ACS), while this report is based on the 2014 ASEC. The ACS provides more geographic detail, while the ASEC is more current.

