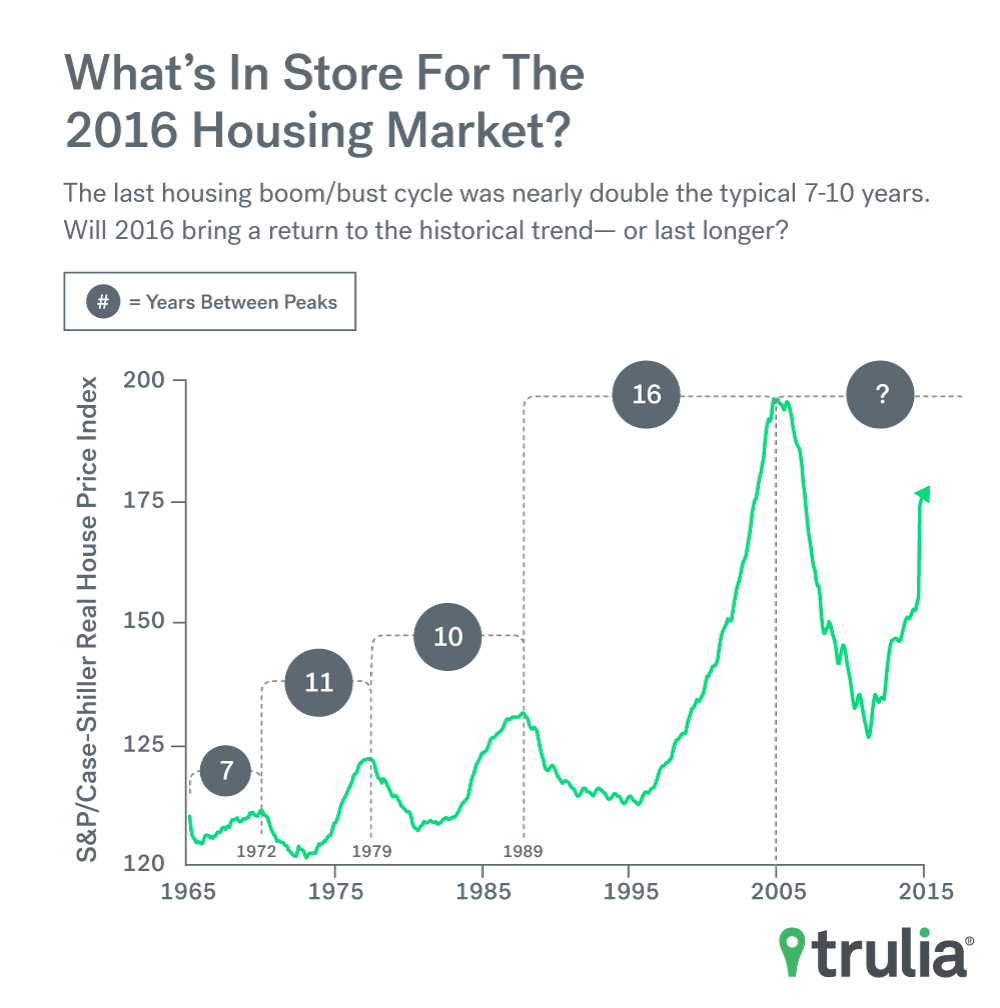
It’s been a decade since the peak of the housing bubble, and the boom and bust seems to have only temporarily diminished Americans’ obsession for real estate. For many, owning a home is making a comeback as an essential part of their personal American Dream. At the same time there’s a growing sense that achieving that dream will be difficult in the year ahead.
As part of our annual look at the year ahead in housing, we commissioned Harris Poll to conduct a survey online in November among more than 2,000 Americans about their housing hopes and fears. We noticed some striking trends. Among them:
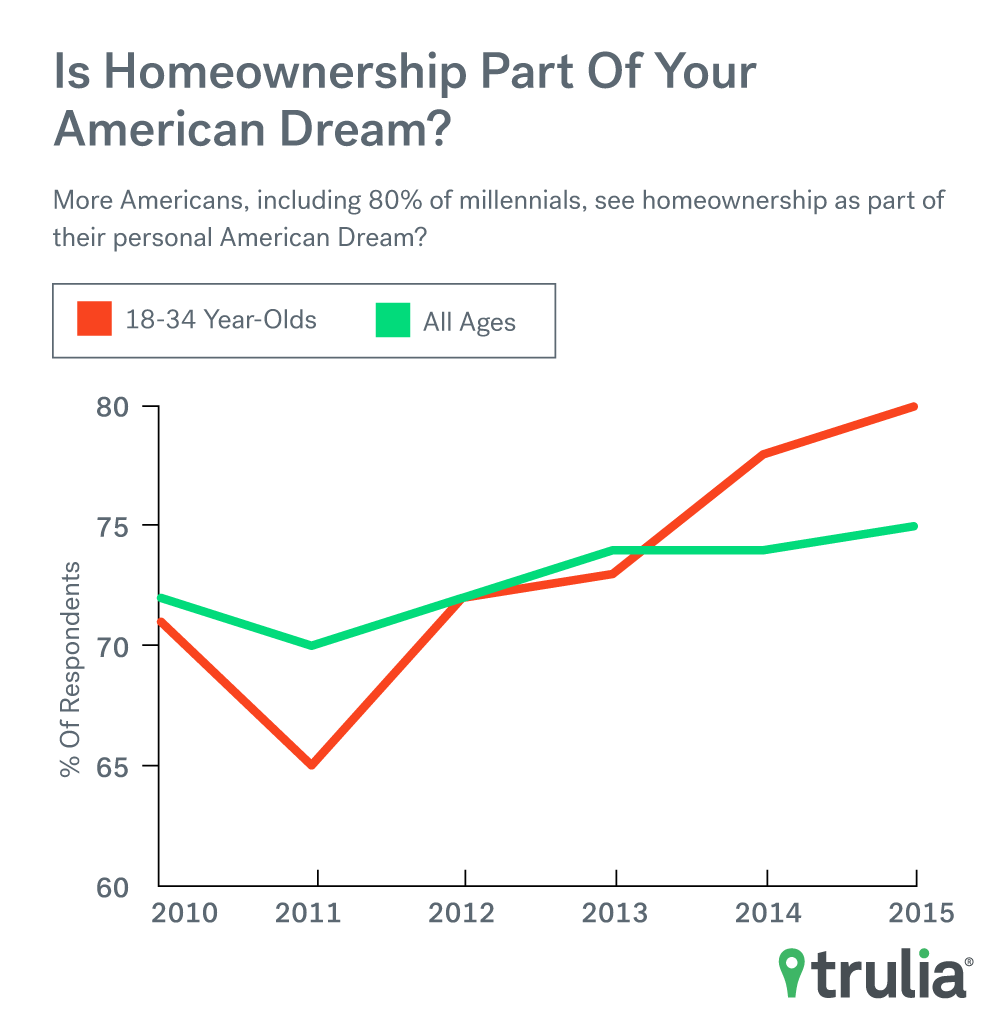
- The American Dream of homeownership is not only alive and well, but continues its resurgence. The share of Americans who dream of owning a home is again up since last year: 1 percentage-point to 75%, and up 2 points among millennials to 80%.
- More than one in five (22%), Americans think it will be harder to get a mortgage in 2016 than it was in 2015, perhaps because of looming interest rate increases.
- Among millennials telling us that they plan to buy a home, nearly a third (31%) tell us they want to buy within two years, so by 2018. However, jobs and down payments are keys to turning these renters into homeowners within the next 12 months.
In addition to the survey, we at Trulia put together a short list of predictions for 2016:
- Housing markets in the West and Northeast that we’ve defined as the Costly Coasts will continue to cool, but will boom in the Southern and Midwestern markets we call the Bargain Belt.
- Renters may get some relief in costly metros, where multifamily construction is booming.
- Buying will remain a better deal than renting nationally, even if mortgage rates increase. But in several California markets, renting might become cheaper than buying.
And finally, we’ve identified a list of 10 markets to watch in 2016 based on a healthy combination of affordability, job growth, and online search activity. Half of these markets are in the Bargain Belt, and so are the top 3: Grand Rapids, Mich., Charleston, S.C., and Austin, Texas.
3 in 4 Americans Still Bullish on Homeownership, but Have Reservations About 2016
Consumers’ fondness for homeownership as part of their American Dream is high and growing slightly. In our survey, we found that three-quarters of Americans (75%) agreed that home ownership is part of achieving their personal American Dream – which is slightly higher than 74% who answered last year and five percentage points higher than in 2012. For young adults, the dream is higher and also up slightly: 80% of 18-34 year-olds answered yes to our American Dream question, up from 78% in 2014 and a low of 65% in 2011.
| % of Americans Who Say Homeownership Is Part of Achieving Their Personal American Dream |
||
| All U.S. Adults | 18-34 Year-Olds | |
| 2010 | 72% | 71% |
| 2011 | 70% | 65% |
| 2012 | 72% | 72% |
| 2013 | 74% | 73% |
| 2014 | 74% | 78% |
| 2015 | 75% | 80% |
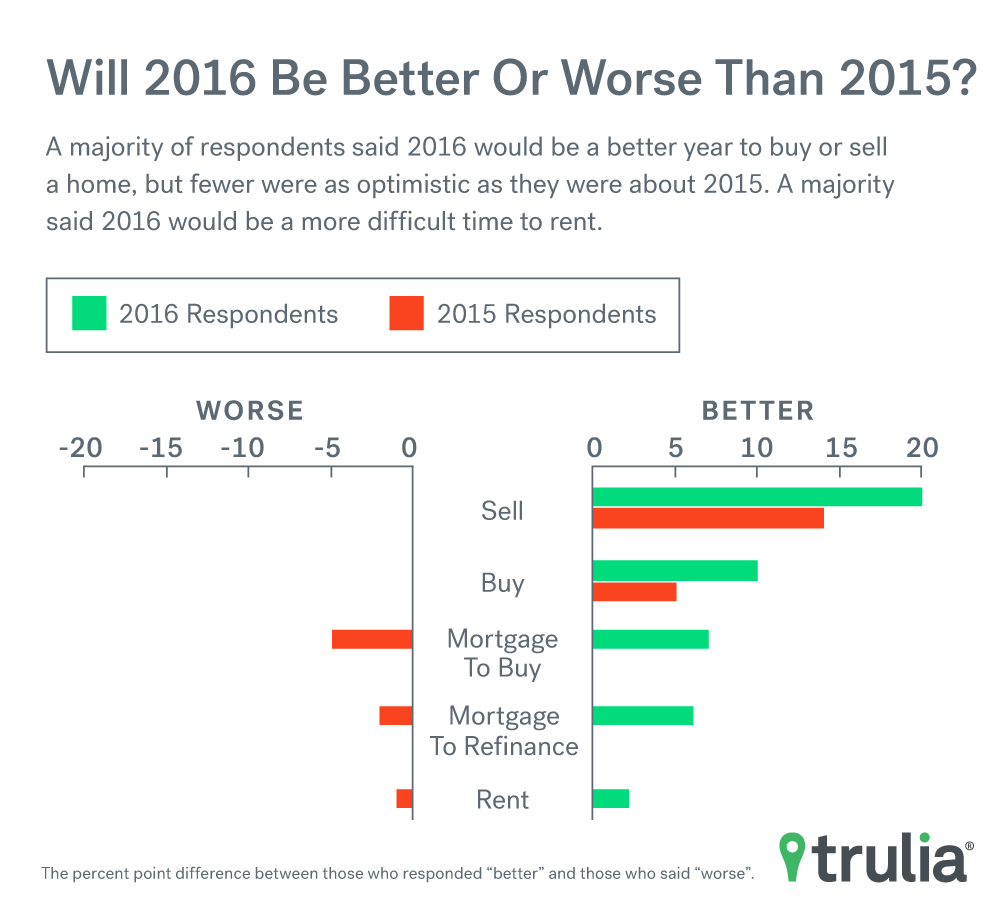
But consumers are having mixed feelings about 2016. First, the good news: 30% of American adults say 2016 will be better than 2015 for selling a home. The bad news: Fewer adults are as confident as they were in last year’s survey. There was a full 20 percentage-point difference than the previous year, but it’s down to 14 points this year. Furthermore, the gap between those who think next year will be better or worse for buying a home has been cut in half to 5 percentage points from 10. Meanwhile, the sentiment around the rental market isn’t any more optimistic. Only a slightly higher number of Americans said that they think 2016 will be worse than 2015 to rent a home than said it will be better.
| Will 2016 Be Better or Worse Than 2015? | ||
| 2014 | 2015 | |
| Sell a Home | +20 | +14 |
| Buy a Home | +10 | +5 |
| Get a Mortgage to Buy a Home | +7 | -5 |
| Get a Mortgage to Refinance a Home | +6 | -2 |
| Rent a Home | +2 | -1 |
| Note: The survey question asked U.S. Adults in 2015 whether they thought 2016 will be better or worse for each of the options above. The percentage of people who said it would be “better” was then subtracted from the percentage who said it would be “worse” to determine their outlook. To illustrate the difference over time, last year’s results are presented, which asked U.S. adults in 2014 whether they though 2015 would be better or worse. The figures above are percentage point differences. | ||
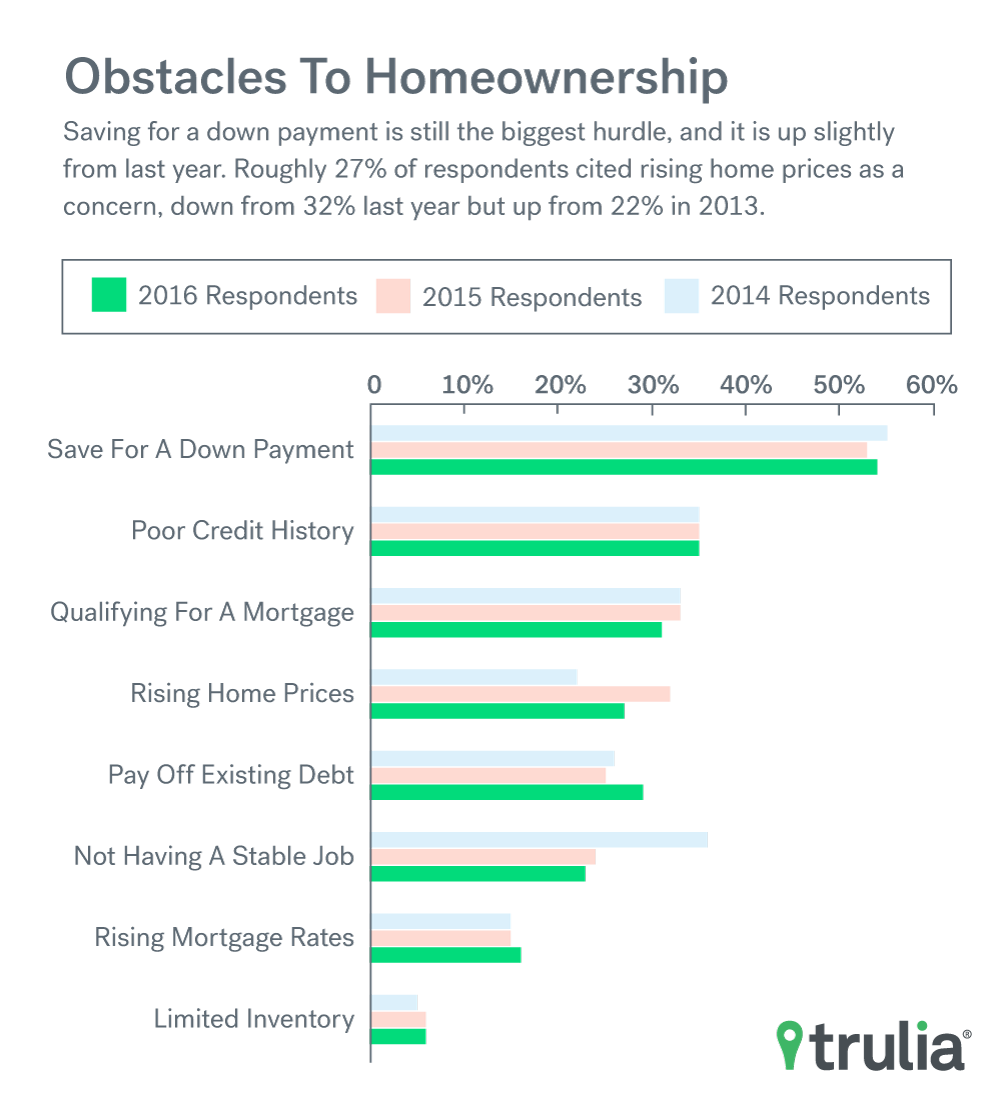
What factors might be driving this drop in optimism home buying and selling? Renters are telling us that saving for a down payment is still the biggest obstacle to home buying (42%), with responses slightly higher than last year, followed by poor credit (27%) and qualifying for a mortgage (24%).
The Federal Reserve has expressed commitment to raising rates at the end of 2015 or early 2016, and consumers may be getting anxious about the prospect of increased mortgage rates. A higher percentage of Americans think getting a mortgage to buy (25%) or refinance (22%) a home will become harder in 2016 than those who think it will be easier (20% for both), even though increased mortgage rates won’t effect the financial advantages of buying in most housing markets.
| What Renters Say Are the Biggest Obstacles to Homeownership | |||
| 2013 | 2014 | 2015 | |
| Saving Enough for a Down Payment | 55% | 53% | 54% |
| Having a Poor Credit History | 35% | 35% | 35% |
| Qualifying for a Mortgage | 33% | 33% | 31% |
| Rising Home Prices | 22% | 32% | 27% |
| Unable to Pay Off Existing Debt | 26% | 25% | 29% |
| Not Having a Stable Job | 36% | 24% | 23% |
| Rising Mortgage Rates | 15% | 15% | 16% |
| Limited Inventory | 5% | 6% | 6% |
| Note: Among renters who plan to buy a home one day. | |||
Will 2016 be the year that millennials finally start to buy homes? Maybe. Among the 18-34 year olds who plan to buy a home, just over 13% say they plan to buy a home within the next 12 months, but that number jumps to over 35% if the timeframe is expanded to within the next two years. But what would make more millennials take the leap from renting to homeownership? More money. When asked what would encourage them to buy a home rather than continue to rent, 51% of millennial renters say that a new job, promotion or raise would, followed by having enough or a down payment (50%) and improved credit history (36%).
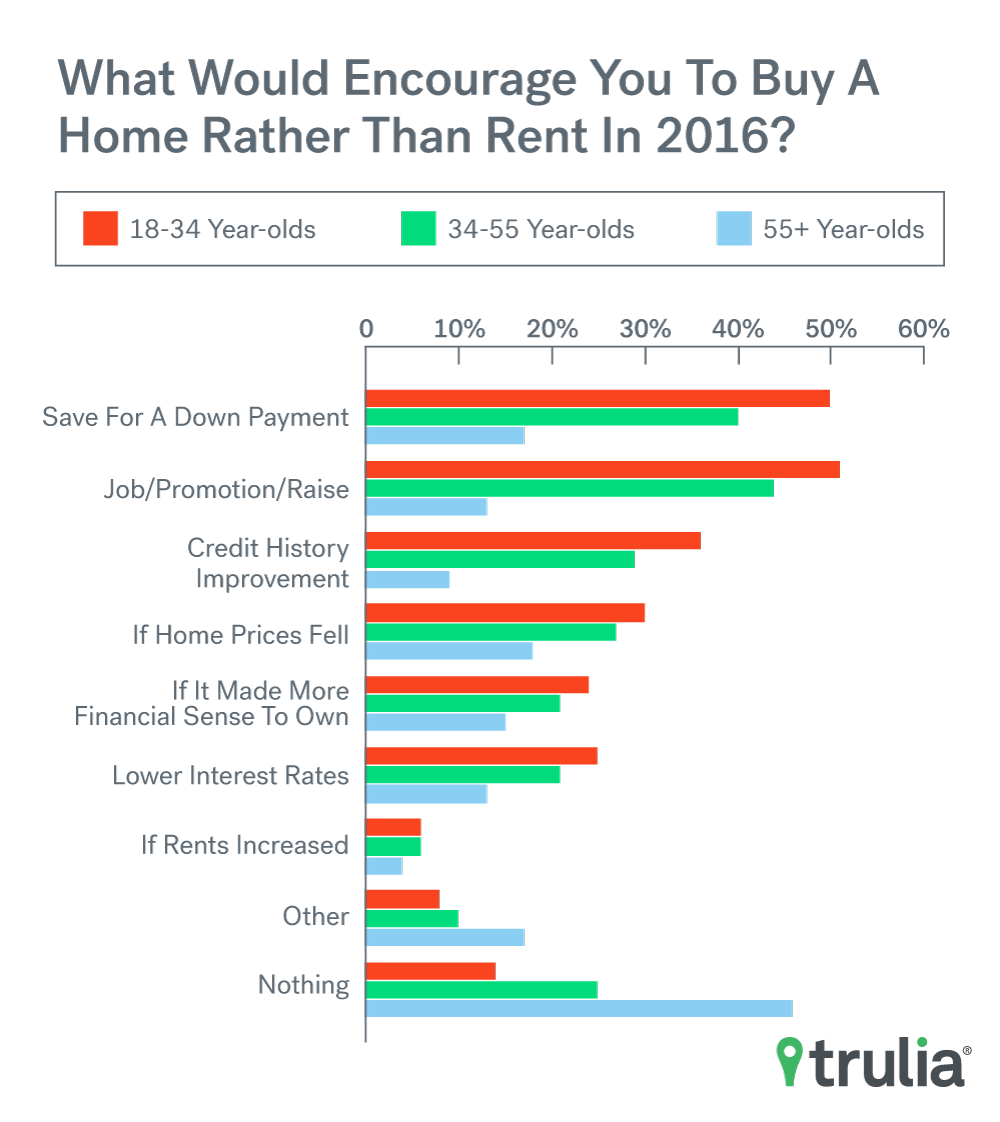
| What Would Encourage Renters to Buy a Home Rather than Rent in the next 12 Months |
|||
| 18-34 | 34-55 | 55+ | |
| Able to Save for a Downpayment | 50% | 40% | 17% |
| Getting a Job/Promotion or Raise | 51% | 44% | 13% |
| Credit History Improvement | 36% | 29% | 9% |
| If Home Prices Fell | 30% | 27% | 18% |
| If it made more financial sense to own | 24% | 21% | 15% |
| Lower Interest Rates | 25% | 21% | 13% |
| If rents increased | 6% | 6% | 4% |
| Other | 8% | 10% | 17% |
| Nothing | 14% | 25% | 46% |
| Note: Among renters only. | |||
Housing in 2016: Costly Coasts Cool, Bargain Belt Booms, and Buying Remains a Bargain
Investors fueled the initial housing market recovery. By the end of 2013, bargain buys were harder to come by, and investors started retreating. 2014 and 2015 brought solid job growth to many metros, which helped fuel an emergence of new households, especially renters. As much of Trulia’s research has shown, this drove a steep year-over-year price and rent increases in many of the coastal markets, but metros in the heartland remained affordable. Will this polarization trend continue, or will the gap between booming metros and stagnant ones converge? Will renters get relief? And will rising interest rates make it a better deal to rent?
Here’s what we expect in 2016:
Costly Coasts Cool
We expect housing markets along the Costly Coasts – namely, expensive metros in the West and Northeast– to continue slowing. In many of these coastal metros, affordability has decreased, homes are staying on the market slightly longer, and saving for a down payment can take decades.
Consumers are also starting to feel pessimistic about homes along the costly coasts. Those in the combined regions of the West and Northeast say getting a mortgage to buy or refinance a home will be worse in 2016 than better (10 percentage-points more said it would be worse than better to get a mortgage to buy a home, 7 points for refinance). Likewise, more Americans in these combined regions also said 2016 will be worse for renting a home than better (by a margin of 8 percentage-points).
Taken together, these factors lead us to believe household formation will wane in these metros 2016, which should help moderate price and rent growth. But due to a limited supply of new single-family homes in these metros, we don’t anticipate prices to fall anytime soon.
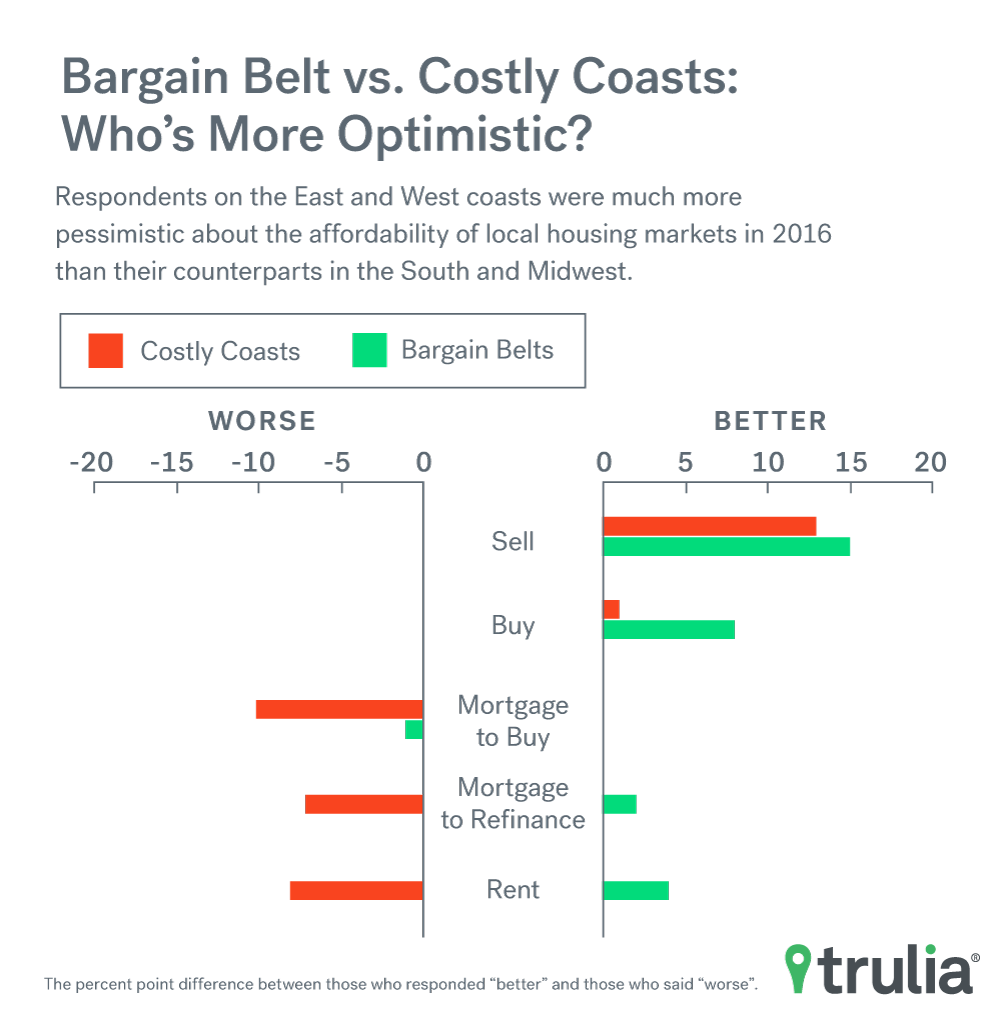
| Bargain Belt vs. Costly Coast: Will 2016 Be Better or Worse Than 2015? | ||
| Costly Coast | Bargain Belt | |
| Sell a Home | +13 | +15 |
| Buy a Home | +1 | +8 |
| Get a Mortgage to Buy a Home | -10 | -1 |
| Get a Mortgage to Refinance a Home | -7 | +2 |
| Rent a Home | -8 | +4 |
| Note: The survey question asked U.S. Adults in 2015 whether they thought 2016 will be better or worse for each of the options above. The percentage of people who said it would be “better” was then subtracted from the percentage who said it would be “worse” to determine their outlook. To illustrate the difference over time, last year’s results are presented, which asked U.S. adults in 2014 whether they though 2015 would be better or worse. The figures above are percentage point differences. | ||
Bargain Belt Booms
On the other hand, we expect highly affordable housing markets in the Midwest and South — an area we’ve identified as the Bargain Belt — to pick up. We’ve seen glimpses of this in 2015: metros like Winston-Salem, N.C., and Charlotte, N.C., have seen the biggest year-over-year increase in how quickly homes move off the market. And in metros like Akron, Ohio, Cincinnati and Kansas City buying was an even better deal in 2015 compared to 2013 and 2014.
Consumers are also upbeat about the Bargain Belt. In every category except getting a mortgage to buy a home, those in the combined region of the South and Midwest think 2016 will be better than worse. The largest differential was in selling a home, but those in the Bargain Belt also feel particularly optimistic about buying and renting a home.
Buying Remains Cheaper than Renting
In 2015, Trulia’s Rent vs. Buy report found that buying was a better deal than renting in 98 of the largest 100 markets and offered the best value in those markets since 2012. Although interest rates are sure to rise, we think buying will continue to beat renting. Nationally, interest rates would have to rise to about 6.5% for the costs of buying to equate renting. The interest rate tipping point for many metros is in the double digits. Coupled with tempered price growth, this should keep buying a better deal than renting.
However, we do expect that a rise in interest rates will affect markets in California. While demand for homes in the Golden State may continue to push higher in 2016, an increase of mortgage rates to 4.5% (read: two 0.25% Fed rate increases) would actually push the rent vs buy math close to renting in the Bay Area, Sacramento, Calif., Ventura County, Calif., and San Diego.
Renters May Get Some Relief
2016 may bring relief for renters, who have endured sharp rent increases in many markets over the past few years. Multifamily housing construction, which disproportionally leads to new rental units, is booming in several markets. New multifamily permits in 2015 were exceptionally high in the Northeast – it’s 423% higher than the 25-year norm in New York, 295% higher in Boston, and 290% higher in Newark, N.J. Multifamily construction is even high relative to historic norms in stingy San Francisco (102% higher) and Los Angeles (160%).
However, much of our prediction is based on expectations that household formation remains steady. New work from our old friend Jed Kolko suggests the share of 18-35 year olds living with their parents today may be the new normal. If this is indeed the trend, new household formation will likely remain steady and new rental supply should keep pace with new demand. However, if the economy surges and younger workers quickly get pulled into the workforce, new household formation may outpace supply and rents increases could continue.
Markets to Watch in 2016
While we expect some of the hottest housing markets to continue cooling in 2016, we have identified 10 markets that we think have strong potential for growth in the year ahead. These markets exhibit strength in five key metrics: strong job growth over the past year, low vacancy rates, high affordability, more inbound home searches than outbound, and a large share of millennials. They are:
- Grand Rapids–Wyoming, MI
- Charleston, SC
- Austin, TX
- Baton Rouge, LA
- San Antonio, TX
- Colorado Springs, CO
- Columbia, SC
- Riverside–San Bernardino, CA
- Las Vegas, NV
- Tacoma, WA
Grand Rapids, Mich., tops our list because it ranks particular affordable (14th most affordable in the US) and has strong job growth (22nd strongest in past year). Charleston, S.C., ranks second because it has even higher job growth (6th in the US) and very high share of inbound home searches (ranked 5th), but falters in affordability (66th) and vacancy rate (52nd). Austin, Texas, ranks third on our list because of its strength in two categories: share of millennials and job growth (ranks 3rd in both categories). Five of our ten metros to watch in 2016 are Southern (Charleston, Austin, Baton Rouge, La., San Antonio, Texas, and Columbia, S.C.), while three are in the non-coastal West (Colorado Springs, Riverside-San Bernardino, and Las Vegas), one in the Midwest (Grand Rapids), and just one in the coastal West (Tacoma, Wash.). No Northeastern metros make our list to watch, primarily because of low affordability, modest employment growth, and relatively few millennials.
Full Survey Methodology
The 2015 survey was conducted online within the United States between November 19th and 23rd, 2015 among 2,016 adults (aged 18 and over) by Harris Poll on behalf of Trulia via its Quick Query omnibus product. Of those surveyed, 1,194 were homeowners and 740 were renters. By age group, 577 are aged 18-34 years old, 706 are aged 35-44 years old, and 733 are aged 55+ years old.
The 2014 survey was conducted online within the United States between November 6th and 10th, 2014 among 2,008 adults (aged 18 and over) by Harris Poll on behalf of Trulia via its Quick Query omnibus product.
Figures for age, sex, race/ethnicity, education, region and household income were weighted where necessary to bring them into line with their actual proportions in the population. Propensity score weighting was used to adjust for respondents’ propensity to be online.
All sample surveys and polls, whether or not they use probability sampling, are subject to multiple sources of error which are most often not possible to quantify or estimate, including sampling error, coverage error, error associated with nonresponse, error associated with question wording and response options, and post-survey weighting and adjustments. Therefore, the words “margin of error” are avoided as they are misleading. All that can be calculated are different possible sampling errors with different probabilities for pure, unweighted, random samples with 100% response rates. These are only theoretical because no published polls come close to this ideal.
Respondents for this survey were selected from among those who have agreed to participate in our surveys. The data have been weighted to reflect the composition of the adult population. Because the sample is based on those who agreed to participate in our panel, no estimates of theoretical sampling error can be calculated.
About The Harris Poll
Over the last 5 decades, Harris Polls have become media staples. With comprehensive experience and precise technique in public opinion polling, along with a proven track record of uncovering consumers’ motivations and behaviors, The Harris Poll has gained strong brand recognition around the world. The Harris Poll offers a diverse portfolio of proprietary client solutions to transform relevant insights into actionable foresight for a wide range of industries including health care, technology, public affairs, energy, telecommunications, financial services, insurance, media, retail, restaurant, and consumer packaged goods. Contact us for more information.


