


73 S Main St
Coventry, RI 02816
 4 Beds
 2.5 Baths
 1,896 sqft (on 0.28 acres)
$490,400
as of Jul 19, 2026
$490,400
as of Jul 19, 2026
4 Beds
2.5 Baths
1,896 sqft
(on 0.28 acres)
Local Information
- Map ViewExplore the area around 73 S Main St.

- Schools1 Elementary School1 Middle School1 High School

- Shop & Eat

-- mins to
Description
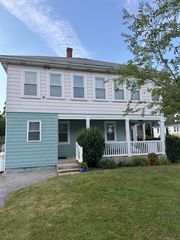
This single-family home is located at 73 S Main St, Coventry, RI. 73 S Main St is in Coventry, RI and in ZIP code 02816. This property has 4 bedrooms, 3 bathrooms and approximately 1,896 sqft of floor space. This property has a lot size of 8712 sqft and was built in 1780.
73 S Main St, Coventry, RI 02816 is a 4 bedroom, 3 bathroom, 1,896 sqft single-family home built in 1780. It last sold for $330,000 on Jul 28, 2022. It is currently off market. The Trulia Estimate is $490,400, with a rent estimate of $3,163/month.
Home Highlights
Parking
Garage
Outdoor
Deck
A/C
Heating only
HOA
None
Price/Sqft
No Info
Listed
Less than a day ago
Home Details for 73 S Main St
|
|---|
Interior Details BasementNumber of Rooms: 8Types of Rooms: Dining Room, Family Room |
Heating & Cooling Heating: Forced Air, OilHeating Fuel: Forced Air |
Levels, Entrance, & Accessibility Stories: 2Floors: Carpet, Hardwood, Laminate, Linoleum Vinyl |
Appliances & Utilities DishwasherDryerRefrigeratorWasher |
Fireplace & Spa Fireplace |
|
|---|
Exterior Home Features Roof: AsphaltDeckExterior: Vinyl |
Parking & Garage GarageParking Spaces: 3Parking: Garage Detached |
|
|---|
Year Built Year Built: 1780 |
Property Type / Style Property Type: Single Family HomeArchitecture: Colonial |
|
|---|
Units in Building: 1 |
|
|---|
Lot Area: 0.28 acres |
Price History for 73 S Main St
| Date | Price | Event | Source |
|---|---|---|---|
| 07/28/2022 | $330,000 | Sold | StateWide MLS RI #1311983 |
| 06/06/2022 | $330,000 | Pending | StateWide MLS RI #1311983 |
| 06/03/2022 | $330,000 | Listed For Sale | StateWide MLS RI #1311983 |
| 09/17/2021 | ListingRemoved | StateWide MLS RI #1284107 | |
| 07/14/2021 | $299,900 | PendingToActive | StateWide MLS RI #1284107 |
| 07/06/2021 | $299,900 | Pending | StateWide MLS RI #1284107 |
| 07/02/2021 | $299,900 | Listed For Sale | StateWide MLS RI #1284107 |
| 07/12/2018 | $185,000 | ListingRemoved | Agent Provided |
| 07/12/2018 | $185,000 | Pending | Agent Provided |
| 07/04/2018 | $185,000 | Listed For Sale | Agent Provided |
| 05/24/2018 | $142,399 | Sold | N/A |
| 11/30/2016 | $142,399 | Sold | N/A |
| 03/30/2016 | $152,000 | Sold | N/A |
| 08/30/2012 | $149,900 | ListingRemoved | Agent Provided |
| 07/19/2012 | $149,900 | Listed For Sale | Agent Provided |
| 05/31/2012 | $81,500 | Sold | N/A |
| 04/18/2012 | $89,900 | Listed For Sale | Agent Provided |
| 01/02/2012 | $147,990 | Sold | N/A |
Market trends in Coventry
Last updated June 2026
Avg. sale price
$468K
$18.33KMoM
Sale-to-List Price
—
Price per sq ft
$261
$2MoM
Available listings
89
16MoM

- Results are loading
Property Tax and Assessment
| Year | 2025 |
|---|---|
| Tax | $5,506 |
| Assessment | $347,600 |
Home facts updated by county records
Comparable Sales for 73 S Main St
Address | Distance | Property Type | Sold Price | Sold Date | Bed | Bath | Sqft |
|---|---|---|---|---|---|---|---|
0.14 | Single-Family Home | $465,000 | 06/25/26 | 4 | 2 | 1,935 | |
0.03 | Single-Family Home | $475,000 | 12/05/25 | 3 | 2 | 2,180 | |
0.36 | Single-Family Home | $585,000 | 03/20/26 | 4 | 3 | 1,798 | |
0.20 | Single-Family Home | $475,000 | 05/21/26 | 3 | 2.5 | 1,932 | |
0.27 | Single-Family Home | $530,000 | 06/18/26 | 4 | 2 | 1,632 | |
0.27 | Single-Family Home | $510,000 | 11/21/25 | 3 | 2 | 1,626 | |
0.20 | Single-Family Home | $385,000 | 08/18/25 | 3 | 2 | 1,194 | |
0.49 | Single-Family Home | $390,000 | 01/28/26 | 3 | 2 | 1,429 | |
0.35 | Single-Family Home | $502,000 | 04/14/26 | 3 | 2 | 2,280 | |
0.43 | Single-Family Home | $420,000 | 04/10/26 | 2 | 2 | 1,456 |
Nearby homes
Get a sense of prices in the area by checking nearby homes. SOLDDEC 2, 2025Williams & Stuart Real Estate
 OFF MARKETWilliams & Stuart Real Estate


Assigned Schools
These are the assigned schools for 73 S Main St.
- Coventry High School
- 9-12
- Public
- 1247 Students
3/10GreatSchools RatingParent Rating AverageThey are limiting student freedom on many things. Students are now no longer able to create bathroom passes and cannot even use an educational app on their given Chromebooks. The bullying also has been getting out of hand, especially for students who need extra help. Lunches look and taste as if they were made by the worst cooks in the country that would make Gordon Ramsay not even step into that lunch room. The only good things at that school are a few teachers. But favoritism is clear among the administration. Most of the money and grants given to the school is always towards their sport team, especially football team that still never win a single win. The bathrooms clearly need to be fixed due to seeing duck tape on a lock once in a bathroom and the vaping problem is out of hand.Student Review7mo ago - Hopkins Hill School
- K-5
- Public
- 341 Students
3/10GreatSchools RatingParent Rating AverageI just moved to the area and did so because I heard such high praise for this school and the surrounding area. I am impressed with my dealings thus far and love my neighbors. What a Great school and beautiful neighborhood. We are so pleased with the sense of community instilled here!Parent Review9y ago - Alan Shawn Feinstein Middle School of Coventry
- 6-8
- Public
- 965 Students
6/10GreatSchools RatingParent Rating AverageMy child started 6th grade here and so far I am not pleased with this school at all. My children broke her ankle and was wearing a cast up to her thigh. She got a letter from her doctor to give to the school asking she get a buddy to help her with her backpack books and so on and that she be given a couple xtra minutes to get to class as she is in crutches. The school literally told my child she is very capable of handling her own books and backpack on her own. That she does not need help and that 3 or 4 minutes is more than enough time to make it to class like anyone else. There will be no extra minute or two and if she is late she will be written up. My child coming home with red raw underarms hurting day after day. This is just ridiculousParent Review9mo ago  Check out schools near 73 S Main St.
What Locals Say about Coventry
At least 96 Trulia users voted on each feature.

95 % Say car is needed

90 % Say parking is easy

89 % Say it's dog friendly

78 % Say yards are well-kept

74 % Say people would walk alone at night

71 % Say there's wildlife

70 % Say there's holiday spirit

67 % Say kids play outside

66 % Say it's quiet

56 % Say neighbors are friendly

50 % Say there are sidewalks

45 % Say streets are well-lit

42 % Say they plan to stay for at least 5 years

38 % Say it's walkable to restaurants

31 % Say it's walkable to grocery stores

24 % Say there are community events
Sourced by Trulia users. Learn more about our methodology.
LGBTQ Local Legal Protections
LGBTQ Local Legal Protections

Apartments for Rent
 PET FRIENDLY
 NEW - 16 HRS AGOPET FRIENDLY
 PET FRIENDLY
 PET FRIENDLYINCOME RESTRICTED
 APPLY INSTANTLY
 APPLY INSTANTLY
 APPLY INSTANTLY
 APPLY INSTANTLY
 PET FRIENDLY
 NEW - 13 HRS AGOAPPLY INSTANTLYPET FRIENDLY
 NEW - 1 DAY AGOAPPLY INSTANTLY
 APPLY INSTANTLY
 See more homes for rent inCoventry
Explore by feature - Pet Friendly
- NEW - 16 HRS AGOSPECIAL OFFERPET FRIENDLY
- PET FRIENDLY
- PET FRIENDLYINCOME RESTRICTED
- NEW - 13 HRS AGOAPPLY INSTANTLYPET FRIENDLY
 SPECIAL OFFERPET FRIENDLY
Explore by feature - Air Conditioning
- NEW - 16 HRS AGOSPECIAL OFFERPET FRIENDLY
- PET FRIENDLYINCOME RESTRICTED
- NEW - 13 HRS AGOAPPLY INSTANTLYPET FRIENDLY
 APPLY INSTANTLY
- SPECIAL OFFERPET FRIENDLY
Explore by feature - Washer/dryer
- NEW - 16 HRS AGOSPECIAL OFFERPET FRIENDLY
- PET FRIENDLY
- PET FRIENDLYINCOME RESTRICTED
- NEW - 13 HRS AGOAPPLY INSTANTLYPET FRIENDLY
 APPLY INSTANTLY
 APPLY INSTANTLY
- APPLY INSTANTLY
- SPECIAL OFFERPET FRIENDLY
Homes for sale near 73 S Main St
 OPEN SUN, 2-4PM0.83 ACRESAmaral & Associaties RE, Inc.
 See more homes for sale inCoventry


Off Market Homes Near 73 S Main St
 SOLDJUL 17, 2026Better Living Real Estate, LLC
 SOLDJUL 17, 2026Keller Williams Leading Edge
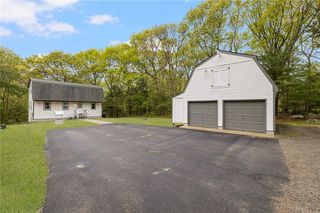 SOLDJUL 15, 2026REMAX Revolution
 SOLDJUL 15, 2026RE/MAX ADVANTAGE GROUP
 SOLDJUL 15, 2026Williams & Stuart Real Estate
 SOLDJUL 15, 2026Coldwell Banker Realty
- See more homes for sale inCoventry


