

Home Value
Trulia Estimate
$874KSince last month
Decreased$5K (-0.5%)Since last year
Increased$352K (+67.4%)Learn more about this home's value by checking out its Trulia Estimate, the value of nearby homes, and how much similar homes have sold for.
Trulia Estimate
The of this home's value increased by +737% in the last 10 years
| Month | Estimated value |
|---|---|
2026 | |
| October 2026 | $874K |
| September 2026 | $878K |
| August 2026 | $821K |
| July 2026 | $692K |
| June 2026 | $792K |
| May 2026 | $879K |
| April 2026 | $1.07M |
| March 2026 | $487K |
| February 2026 | $615K |
| January 2026 | $597K |
2025 | |
2024 | |
2023 | |
2022 | |
2021 | |
2020 | |
2019 | |
2018 | |
2017 | |
2016 | |
Comparable sales
These are recently sold homes that have a similar location or other similar features to this home, like bedrooms, bathrooms, and square footage. Get a sense of the expected prices in the area by viewing these homes.Address | Distance | Property Type | Sold Price | Sold Date | Bed | Bath | Sqft |
|---|---|---|---|---|---|---|---|
0.76 | Multi-Family Home | $370,000 | 12/10/25 | 6 | 4 | 1,944 | |
0.78 | Multi-Family Home | $355,000 | 12/10/25 | 6 | 4 | 1,944 | |
0.78 | Multi-Family Home | $435,000 | 12/16/25 | 6 | 4 | 1,944 | |
0.83 | Multi-Family Home | $351,500 | 09/03/26 | - | 1,944 | ||
0.83 | Multi-Family Home | $351,500 | 08/31/26 | 6 | 4 | 1,944 | |
0.93 | Multi-Family Home | $415,000 | 01/15/26 | 6 | 4 | 1,992 | |
1.03 | Multi-Family Home | $330,000 | 05/11/26 | - | 1,456 | ||
1.06 | Multi-Family Home | $1,900,000 | 02/17/26 | 4 | 3 | 2,946 | |
1.11 | Multi-Family Home | $380,000 | 03/24/26 | 3 | 4 | 1,988 | |
1.12 | Multi-Family Home | $380,000 | 03/20/26 | 6 | 4 | 1,988 |
Nearby home prices
Get a sense of expected prices in the area by checking the value of nearby homes.Address | Distance | Price | Bed | Bath | Sqft | Status |
|---|---|---|---|---|---|---|
0.01 | - | - | - | - | Off Market | |
0.03 | - | - | - | - | Off Market | |
0.05 | - | - | - | - | Off Market | |
0.05 | - | - | - | - | Off Market | |
0.05 | $894,400 | Studio | - | - | Off Market | |
0.09 | - | - | - | - | Off Market | |
0.16 | $5,751,600 | Studio | - | 36,560 | Off Market | |
0.17 | $1,507,100 | Studio | - | 11,300 | Off Market | |
0.17 | $2,908,800 | Studio | - | 16,000 | Off Market | |
0.17 | $1,976,500 | Studio | - | 3,920 | Off Market | |
0.20 | - | Studio | - | 39,820 | Off Market | |
0.22 | $4,743,600 | Studio | - | 56,525 | Off Market | |
0.23 | $1,630,800 | Studio | - | 11,932 | Off Market | |
0.23 | - | - | - | - | Off Market | |
0.24 | $2,113,700 | Studio | - | 16,640 | Off Market | |
0.24 | - | 2 | 1 | 1,440 | Off Market | |
0.24 | $1,678,800 | Studio | - | 11,916 | Off Market | |
0.27 | - | Studio | - | 21,750 | Off Market | |
0.28 | $4,289,400 | Studio | - | 36,563 | Off Market | |
0.28 | - | - | - | - | Off Market |
Local Information
- Map ViewExplore the area around 2133 63rd Ave E.

- Schools1 Preschool School1 Elementary School2 Middle Schools1 High School

- Shop & Eat

-- mins to
Home Highlights

Multi-Family

Built in 1986
About this House
Nice, convenient offices. 1,725 SF unit with one enclosed room with the balance being open and restroom. Offered at $8.60/SF. 862 SF unit also available at a highly visible corner of the building with one enclosed office, one restroom, great signage and lots of parking! Located in an industrial area near the airport and highways. 12-60 month lease term available. Offered at $8.91/SF (gross lease). 5,175 SF flex space unit (1,000 SF office space) also available at $6.64/SF (gross lease). Contact agent for all showings.<br/><br/>Brokered And Advertised By: PREFERRED COMMERCIAL INC<br/>Listing Agent: CARL WISE
2133 63rd Ave E, Bradenton, FL 34203 is a studio multi-family built in 1986. This property is not currently displayed as for sale or rent on Trulia. The Trulia Estimate is $873,500, with a rent estimate of $2,223/month.
Home Details for 2133 63rd Ave E

|
|---|
Year Built Year Built: 1986 |
Property Type / Style Property Type: Multi Family |
Price and Tax history
| Date | Event | Price |
|---|---|---|
Jul 24, 2010 Source: Agent Provided | ListingRemoved | $14,835 |
Feb 4, 2010 Source: Agent Provided | Listed For Sale | $14,835 |
Market trends in Bradenton
Last updated September 2026
Avg. sale price
$368K
$5.2KMoM
Sale-to-List Price
96.8%
0.2%MoM
Price per sq ft
$228
$3MoM
Available listings
1755
14MoM
Sourced by Trulia Market Trends
Around this home
What Locals Say about Bradenton
This October
Trick-or-Treat Score
Built from what locals say about this neighborhood.- 72% say there's holiday spirit
- 68% say there are sidewalks
- 52% say neighbors are friendly
Trulia Trick or TreatStart Ghost Hunt
At least 1167 Trulia users voted on each feature.

86 % Say car is needed

84 % Say it's dog friendly

79 % Say parking is easy

72 % Say there's holiday spirit

70 % Say yards are well-kept

68 % Say there are sidewalks

65 % Say it's quiet

57 % Say people would walk alone at night

52 % Say neighbors are friendly

52 % Say kids play outside

51 % Say streets are well-lit

50 % Say there's wildlife

49 % Say they plan to stay for at least 5 years

47 % Say it's walkable to grocery stores

44 % Say it's walkable to restaurants

28 % Say there are community events
Sourced by Trulia users. Learn more about our methodology.
LGBTQ Local Legal Protections
LGBTQ Local Legal Protections


Frequently asked questions about 2133 63rd Ave E
- What is 2133 63rd Ave E estimated to be worth?Trulia's estimated value for 2133 63rd Ave E in Bradenton, FL is $873,500.
- Is Bradenton a buyer's or seller's market?Bradenton is currently a balanced market, based on recent for-sale activity.
- What's the median sale price in Bradenton?The median sale price in Bradenton is $368K. That is up $5.2K from the prior month.
- What do residents say about Bradenton?Residents describe Bradenton, FL as dog-friendly, easy to park in, and well-kept. Most residents say you need a car. See recently sold homes in Bradenton, FL.
Explore by feature - Pet Friendly
 SPECIAL OFFERSENIOR HOUSINGPET FRIENDLYTotal price$1,800 - $3,800/mo
 1-2 bd
 1-2 baThe Pointe at Lakewood Ranch - 55+ Active Adult Apartment Homes | 8925 77th Ter E,
Bradenton, FL 34202 SPECIAL OFFERPET FRIENDLYTotal price$1,695 - $3,165/mo1-3 bd1-2 baForayna Watercolor Place | 120 Watercolor Way,
Bradenton, FL 34212 NEW - 18 HRS AGOSPECIAL OFFERPET FRIENDLYTotal price$1,599 - $2,631/mo1-3 bd1-2 baMarlowe Lake Manatee | 14370 E State Road 64,
Bradenton, FL 34211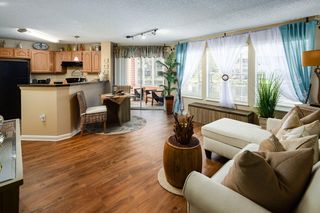 SPECIAL OFFERPET FRIENDLY
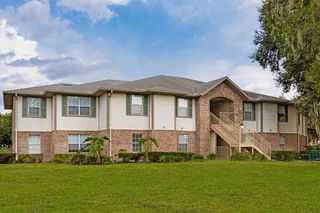 SPECIAL OFFERPET FRIENDLY
 SPECIAL OFFERPET FRIENDLY
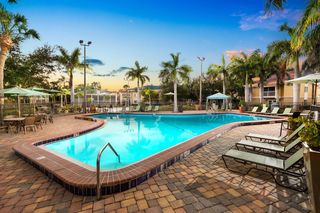 SPECIAL OFFERPET FRIENDLY
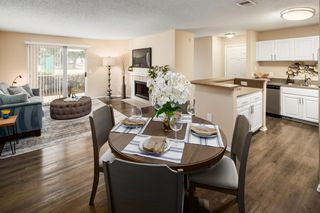 SPECIAL OFFERPET FRIENDLY
 SPECIAL OFFERPET FRIENDLY
 SPECIAL OFFERPET FRIENDLY
Explore by feature - Garage
- SPECIAL OFFERPET FRIENDLY
- SPECIAL OFFERPET FRIENDLY
 SPECIAL OFFERPET FRIENDLY
 SPECIAL OFFERPET FRIENDLY
 SPECIAL OFFERPET FRIENDLYFURNISHED$1,221 - $1,742/moStudio-2 bd1-2 baSprings at Palma Sola Apartments | 4601 66th St W,
Bradenton, FL 34210 SPECIAL OFFERPET FRIENDLY
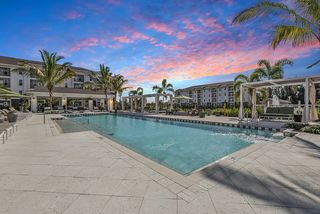 SPECIAL OFFERPET FRIENDLY
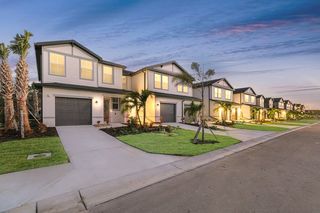 NEW - 1 DAY AGOSPECIAL OFFER
 SPECIAL OFFERPET FRIENDLY
 SPECIAL OFFERPET FRIENDLY$1,624 - $2,269/mo1-3 bd1-2 baBlue Heron Living: Creek | Lakes | Preserve Apartment Homes | 420 Salt Meadow Cir,
Bradenton, FL 34208
Explore by feature - Air Conditioning
- SPECIAL OFFERSENIOR HOUSINGPET FRIENDLYTotal price$1,800 - $3,800/mo1-2 bd1-2 baThe Pointe at Lakewood Ranch - 55+ Active Adult Apartment Homes | 8925 77th Ter E,
Bradenton, FL 34202 - SPECIAL OFFERPET FRIENDLYTotal price$1,695 - $3,165/mo1-3 bd1-2 baForayna Watercolor Place | 120 Watercolor Way,
Bradenton, FL 34212 - SPECIAL OFFERPET FRIENDLY
- SPECIAL OFFERPET FRIENDLY
 NEW - 15 HRS AGOSPECIAL OFFERPET FRIENDLY$1,419 - $3,075/moStudio-3 bd1-2 baThe Stadler Luxury Apartments | 7120 Henry Dr,
Bradenton, FL 34210 NEW - 1 DAY AGOSPECIAL OFFERPET FRIENDLY
- SPECIAL OFFERPET FRIENDLYFURNISHED$1,221 - $1,742/moStudio-2 bd1-2 baSprings at Palma Sola Apartments | 4601 66th St W,
Bradenton, FL 34210  SPECIAL OFFERPET FRIENDLY
 PET FRIENDLY
 SPECIAL OFFERPET FRIENDLY
Explore by feature - Pool
 NEW - 29 MIN AGO
- PET FRIENDLY
 NEW - 1 HR AGOPET FRIENDLY$1,411 - $1,856/mo2-4 bd2-3 baVenue at Lockwood Apartment Homes | 5385 30th St E,
Bradenton, FL 34203 NEW - 1 HR AGOSPECIAL OFFERPET FRIENDLYTotal price$1,305 - $2,506/moStudio-3 bd1-3 baView Carlton Arms | 1191 Carlton Arms Cir,
Bradenton, FL 34208- SPECIAL OFFERPET FRIENDLY
 NEW - 1 HR AGOSPECIAL OFFER
- SPECIAL OFFERPET FRIENDLY
- NEW - 4 HRS AGOSPECIAL OFFER
 NEW - 4 HRS AGOAPPLY INSTANTLYPET FRIENDLY
 PET FRIENDLY

Explore by feature - Washer/dryer
- SPECIAL OFFERSENIOR HOUSINGPET FRIENDLYTotal price$1,800 - $3,800/mo1-2 bd1-2 baThe Pointe at Lakewood Ranch - 55+ Active Adult Apartment Homes | 8925 77th Ter E,
Bradenton, FL 34202 - SPECIAL OFFERPET FRIENDLYTotal price$1,695 - $3,165/mo1-3 bd1-2 baForayna Watercolor Place | 120 Watercolor Way,
Bradenton, FL 34212 - NEW - 18 HRS AGOSPECIAL OFFERPET FRIENDLYTotal price$1,599 - $2,631/mo1-3 bd1-2 baMarlowe Lake Manatee | 14370 E State Road 64,
Bradenton, FL 34211 - SPECIAL OFFERPET FRIENDLY
- SPECIAL OFFERPET FRIENDLY
- SPECIAL OFFERPET FRIENDLY
- SPECIAL OFFERPET FRIENDLY
- SPECIAL OFFERPET FRIENDLY
- SPECIAL OFFERPET FRIENDLYTotal price$1,305 - $2,506/moStudio-3 bd1-3 baView Carlton Arms | 1191 Carlton Arms Cir,
Bradenton, FL 34208 - SPECIAL OFFERPET FRIENDLY
Explore by feature - Outdoor Space
 SPECIAL OFFERPET FRIENDLY
 APPLY INSTANTLYPET FRIENDLY
 APPLY INSTANTLYPET FRIENDLY
 APPLY INSTANTLYPET FRIENDLY
 APPLY INSTANTLYPET FRIENDLY
 APPLY INSTANTLYPET FRIENDLY
 APPLY INSTANTLYFURNISHED
 APPLY INSTANTLYPET FRIENDLY
 APPLY INSTANTLY
 APPLY INSTANTLYPET FRIENDLY
Apartments for Rent
 PET FRIENDLYTotal price$1,530 - $2,927/mo1-3 bd1-2 baThe Crossings at Palm Aire | 4665 Whitfield Ave,
Sarasota, FL 34243 PET FRIENDLY
 SENIOR HOUSINGPET FRIENDLY$2,025 - $5,773/mo1-2 bd1-2 baThe Alloro at University Groves | 3540 Broadway Ave,
Sarasota, FL 34243 NEW - 1 DAY AGOPET FRIENDLY
 NEW - 1 DAY AGOPET FRIENDLY
- PET FRIENDLY
 PET FRIENDLY
 PET FRIENDLY
 NEW - 1 DAY AGOPET FRIENDLY
- PET FRIENDLY
 PET FRIENDLY
 PET FRIENDLY
 PET FRIENDLY
 NEW - 1 DAY AGOPET FRIENDLY
 PET FRIENDLY
 See more homes for rent inBradenton
Off Market Homes Near 2133 63rd Ave E
 SOLDOCT 16, 2026PREFERRED SHORE LLC
 SOLDOCT 16, 2026REDFIN CORPORATION
 SOLDOCT 16, 2026SARABAY REAL ESTATE INC
 SOLDOCT 16, 2026COLDWELL BANKER REALTY
 SOLDOCT 16, 2026MICHAEL SAUNDERS & COMPANY
 SOLDOCT 16, 2026ALLEGIANT REAL ESTATE GROUP
 SOLDOCT 15, 2026EVRON & MCCARTHY REALTY LLC
 SOLDOCT 14, 2026COLDWELL BANKER REALTY
 SOLDOCT 14, 2026COLDWELL BANKER REALTY
 See more homes for sale inBradenton

Homes for sale near 2133 63rd Ave E
 SRQ INTERNATIONAL REALTY LLC
- See more homes for sale inBradenton


- Results are loading