


Home Value
Trulia Estimate
$764KSince last month
Decreased$24K (-3%)Since last year
Decreased$12K (-1.6%)Since last sale
Increased$349K (+84.1%)Learn more about this home's value by checking out its Trulia Estimate, the value of nearby homes, and how much similar homes have sold for.
Trulia Estimate
The of this home's value increased by +80% in the last 10 years
| Month | Estimated value |
|---|---|
2026 | |
| November 2026 | $764K |
| October 2026 | $771K |
| September 2026 | $788K |
| August 2026 | $787K |
| July 2026 | $793K |
| June 2026 | $799K |
| May 2026 | $801K |
| April 2026 | $798K |
| March 2026 | $776K |
| February 2026 | $768K |
| January 2026 | $753K |
2025 | |
2024 | |
2023 | |
2022 | |
2021 | |
2020 | |
2019 | |
2018 | |
2017 | |
2016 | |
Comparable sales
These are recently sold homes that have a similar location or other similar features to this home, like bedrooms, bathrooms, and square footage. Get a sense of the expected prices in the area by viewing these homes.Address | Distance | Property Type | Sold Price | Sold Date | Bed | Bath | Sqft |
|---|---|---|---|---|---|---|---|
0.17 | Single-Family Home | - | 12/16/25 | 4 | 2.5 | 3,513 | |
0.36 | Single-Family Home | - | 06/10/26 | 4 | 2.5 | 2,996 | |
0.27 | Single-Family Home | - | 06/03/26 | 5 | 3 | 2,150 | |
0.19 | Single-Family Home | - | 08/06/26 | 6 | 3.5 | 4,518 | |
0.42 | Single-Family Home | - | 05/29/26 | 4 | 3 | 3,073 | |
0.34 | Single-Family Home | - | 05/12/26 | 5 | 2 | 1,870 | |
0.22 | Single-Family Home | - | 12/02/25 | 5 | 3 | 2,868 | |
0.34 | Single-Family Home | - | 02/26/26 | 5 | 2 | 1,890 | |
0.23 | Single-Family Home | - | 10/23/26 | 6 | 4 | 3,320 | |
0.28 | Single-Family Home | - | 11/20/25 | 3 | 3 | 2,976 |
Nearby home prices
Get a sense of expected prices in the area by checking the value of nearby homes.Address | Distance | Price | Bed | Bath | Sqft | Status |
|---|---|---|---|---|---|---|
0.00 | - | - | - | - | Off Market | |
0.02 | $727,300 | 1 | 1 | 784 | Off Market | |
0.02 | $595,100 | 4 | 3 | 1,580 | Off Market | |
0.02 | $746,900 | 5 | 3 | 3,534 | Off Market | |
0.02 | - | - | - | - | Off Market | |
0.03 | - | - | - | - | Off Market | |
0.03 | $684,700 | 3 | 3 | 1,754 | Off Market | |
0.03 | $697,600 | 4 | 2 | 2,108 | Off Market | |
0.03 | $802,300 | 5 | 3 | 1,494 | Off Market | |
0.03 | $621,800 | 4 | 2.5 | 2,526 | Off Market | |
0.03 | $712,100 | 5 | 3 | 1,675 | Off Market | |
0.03 | $699,000 | 4 | 2 | 2,113 | Off Market | |
0.04 | $711,500 | 4 | 2 | 2,326 | Off Market | |
0.04 | - | - | - | - | Off Market | |
0.04 | $818,300 | 4 | 3 | 2,508 | Off Market | |
0.04 | $665,800 | 3 | 3 | 2,648 | Off Market | |
0.04 | $724,900 | 3 | 2.5 | 3,021 | Off Market | |
0.04 | $703,300 | 3 | 2.5 | 3,021 | Off Market | |
0.04 | $701,300 | 6 | 3.5 | 2,978 | Off Market | |
0.04 | - | - | - | - | Off Market |
Local Information
- Map ViewExplore the area around 1971 E Falcon Hurst Ct.

- Schools1 Elementary School2 Middle Schools1 High School

- Shop & Eat

-- mins to
Home Highlights

Single-Family Home

Built in 1978

3,352 sqft

$228/sqft

Garage
About this House
New remodel in Desirable East Sandy Culdesac! 4 beds, 3 1/2 baths. 2-car garage. Updates throughout! Large master bedroom with separate bath and enormous walk-in closet. Updated kitchen, appliances, flooring and paint! Fully finished basement with basement entrance. Nice large deck off the back. Enclosed hot tub room. Easy to show, see it today!
1971 E Falcon Hurst Ct, Sandy, UT 84092 is a 4 bedroom, 2 bathroom, 3,352 sqft single-family home built in 1978. It was last sold on Jan 25, 2017. This property is not currently displayed as for sale or rent on Trulia. The Trulia Estimate is $764,300, with a rent estimate of $3,037/month.
Home Details for 1971 E Falcon Hurst Ct

|
|---|
Interior Details BasementNumber of Rooms: 16Types of Rooms: Dining Room, Family Room |
Heating & Cooling Heating: Forced Air, GasAir ConditioningCooling System: CentralHeating Fuel: Forced Air |
Levels, Entrance, & Accessibility Stories: 2Floors: Tile, Carpet, Laminate |
Appliances & Utilities Microwave |
Fireplace & Spa Fireplace |

|
|---|
Exterior Home Features Roof: AsphaltDeckExterior: Other, Vinyl |
Parking & Garage GarageParking: Garage Attached |

|
|---|
Year Built Year Built: 1978Year Updated: 1998 |
Property Type / Style Property Type: Single Family HomeArchitecture: Conventional |

|
|---|
Units in Building: 1 |

|
|---|
Lot Area: 8712 sqft |
Price and Tax history
| Date | Event | Price |
|---|---|---|
Jan 25, 2017 Source: N/A | Sold | -- |
Jan 5, 2017 Source: Agent Provided | Pending | $415,000 |
Dec 4, 2016 Source: Agent Provided | PriceChange | $415,000 Price decreased by 2% |
Nov 12, 2016 Source: Agent Provided | PriceChange | $425,000 Price decreased by 1% |
Oct 28, 2016 Source: Agent Provided | Listed For Sale | $429,000 |
Jun 21, 2016 Source: Agent Provided | ListingRemoved | $349,000 |
May 21, 2016 Source: Agent Provided | Listed For Sale | $349,000 |
May 18, 2016 Source: N/A | Sold | -- |
Jun 2, 2015 Source: N/A | Sold | -- |
Feb 21, 2015 Source: Agent Provided | ListingRemoved | $292,500 |
Feb 19, 2015 Source: Agent Provided | Listed For Sale | $292,500 |
Nov 8, 2014 Source: Agent Provided | ListingRemoved | $293,000 |
Oct 9, 2014 Source: Agent Provided | Listed For Sale | $293,000 |
Jun 15, 2014 Source: Agent Provided | ListingRemoved | $279,900 |
Jun 6, 2014 Source: Agent Provided | PriceChange | $279,900 Price decreased by 3% |
May 16, 2014 Source: Agent Provided | PriceChange | $289,000 Price decreased by 3% |
Apr 22, 2014 Source: Agent Provided | PriceChange | $299,000 Price decreased by 2% |
Apr 15, 2014 Source: Agent Provided | PriceChange | $304,000 Price decreased by 2% |
Apr 4, 2014 Source: Agent Provided | PriceChange | $309,000 Price decreased by 3% |
Mar 21, 2014 Source: Agent Provided | PriceChange | $319,000 Price increased by 14% |
Dec 3, 2013 Source: Agent Provided | PriceChange | $279,900 Price decreased by 3% |
Nov 20, 2013 Source: Agent Provided | PriceChange | $289,900 Price decreased by 3% |
Nov 12, 2013 Source: Agent Provided | PriceChange | $299,900 Price decreased by 5% |
Oct 15, 2013 Source: Agent Provided | PriceChange | $314,900 Price decreased by 3% |
Sep 27, 2013 Source: Agent Provided | Listed For Sale | $324,900 |
Aug 4, 2006 Source: N/A | Sold | -- |
May 15, 2006 Source: N/A | Sold | -- |
| Year | Property tax | Tax assessment |
|---|---|---|
| 2025 | $3,905 | $735,300 |
Home facts updated by county records
Market trends in Sandy
Last updated September 2026
Avg. sale price
$702K
$20KMoM
Sale-to-List Price
99.0%
0.4%MoM
Price per sq ft
$275
$2MoM
Available listings
317
14MoM
Sourced by Trulia Market Trends
Around this home
What Locals Say about Sandy
At least 335 Trulia users voted on each feature.

90 % Say there are sidewalks

90 % Say it's dog friendly

88 % Say car is needed

88 % Say parking is easy

77 % Say yards are well-kept

76 % Say streets are well-lit

76 % Say there's holiday spirit

73 % Say kids play outside

73 % Say people would walk alone at night

72 % Say it's quiet

54 % Say neighbors are friendly

52 % Say it's walkable to grocery stores

47 % Say they plan to stay for at least 5 years

44 % Say it's walkable to restaurants

39 % Say there are community events

35 % Say there's wildlife
Sourced by Trulia users. Learn more about our methodology.
LGBTQ Local Legal Protections
LGBTQ Local Legal Protections


Frequently asked questions about 1971 E Falcon Hurst Ct
- What is 1971 E Falcon Hurst Ct estimated to be worth?Trulia's estimated value for 1971 E Falcon Hurst Ct in Sandy, UT is $764,300.
- What is the price history for 1971 E Falcon Hurst Ct?1971 E Falcon Hurst Ct in Sandy, UT last sold in January 2017.
- Is Sandy a buyer's or seller's market?Sandy is currently a buyer's market, based on recent for-sale activity.
- What's the median sale price in Sandy?The median sale price in Sandy is $702K. That is down $20K from the prior month.
- Does 1971 E Falcon Hurst Ct have air conditioning?Yes, 1971 E Falcon Hurst Ct in Sandy, UT has air conditioning.
- How big is the lot at 1971 E Falcon Hurst Ct?The lot at 1971 E Falcon Hurst Ct in Sandy, UT is about 0.20 acres (8,712 sq ft).
Explore by feature - Pet Friendly
 SPECIAL OFFERSENIOR HOUSINGPET FRIENDLY
 SPECIAL OFFERPET FRIENDLY
 SPECIAL OFFERPET FRIENDLY
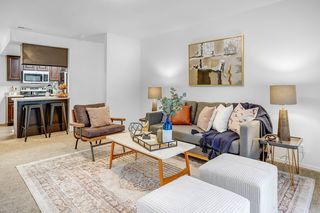 PET FRIENDLY
 SENIOR HOUSINGPET FRIENDLYINCOME RESTRICTED
 SPECIAL OFFERPET FRIENDLYINCOME RESTRICTED
 SPECIAL OFFERPET FRIENDLYINCOME RESTRICTED
 SPECIAL OFFERPET FRIENDLY
 NEW - 2 DAYS AGOSPECIAL OFFERPET FRIENDLY
 SPECIAL OFFERPET FRIENDLYFURNISHED
Explore by feature - Garage
- SPECIAL OFFERPET FRIENDLY
- PET FRIENDLY
 PET FRIENDLY
 SPECIAL OFFERPET FRIENDLY
 SPECIAL OFFERPET FRIENDLY
 PET FRIENDLYFURNISHED
 SPECIAL OFFERPET FRIENDLY
 PET FRIENDLYFURNISHED
 PET FRIENDLY
 APPLY INSTANTLYPET FRIENDLY
Explore by feature - Air Conditioning
- SPECIAL OFFERPET FRIENDLY
- SPECIAL OFFERPET FRIENDLY
- SENIOR HOUSINGPET FRIENDLYINCOME RESTRICTED
- SPECIAL OFFERPET FRIENDLYINCOME RESTRICTED
- SPECIAL OFFERPET FRIENDLYINCOME RESTRICTED
- NEW - 2 DAYS AGOSPECIAL OFFERPET FRIENDLY
- SPECIAL OFFERPET FRIENDLYFURNISHED
 NEW - 1 DAY AGOSPECIAL OFFERPET FRIENDLY
- PET FRIENDLY
- SPECIAL OFFERPET FRIENDLY
Explore by feature - Pool
 NEW - 1 HR AGOSPECIAL OFFERPET FRIENDLY
- NEW - 1 DAY AGOSPECIAL OFFERPET FRIENDLY
 NEW - 1 DAY AGOSPECIAL OFFER
- NEW - 2 DAYS AGOSPECIAL OFFERPET FRIENDLY
- NEW - 2 DAYS AGOSPECIAL OFFERPET FRIENDLYINCOME RESTRICTED
- SPECIAL OFFERPET FRIENDLY
- SPECIAL OFFERPET FRIENDLY
 SPECIAL OFFERPET FRIENDLYTotal price$1,679 - $2,175/mo
 1-3 bd
 1-2 baRockledge at Quarry Bend | 903 E Cobblegate Dr,
Sandy, UT 84094- SPECIAL OFFERPET FRIENDLY
- PET FRIENDLY
Explore by feature - Washer/dryer
- SPECIAL OFFERSENIOR HOUSINGPET FRIENDLY
- SPECIAL OFFERPET FRIENDLY
- SPECIAL OFFERPET FRIENDLY
- SENIOR HOUSINGPET FRIENDLYINCOME RESTRICTED
- SPECIAL OFFERPET FRIENDLYINCOME RESTRICTED
- SPECIAL OFFERPET FRIENDLYINCOME RESTRICTED
- NEW - 2 DAYS AGOSPECIAL OFFERPET FRIENDLY
- SPECIAL OFFERPET FRIENDLYFURNISHED
 PET FRIENDLY
- NEW - 1 DAY AGOSPECIAL OFFERPET FRIENDLY
Explore by feature - Outdoor Space
- APPLY INSTANTLYPET FRIENDLY
 APPLY INSTANTLY


 PET FRIENDLY
 FURNISHED
 PET FRIENDLY
 PET FRIENDLYFURNISHED
Apartments for Rent
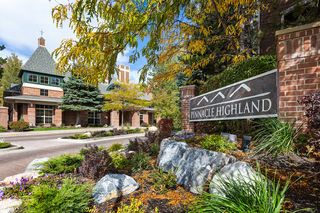 PET FRIENDLY$1,509 - $1,942/mo1-2 bd1-2 baPinnacle Highland Apartments | 7673 S Highland Dr,
Salt Lake City, UT 84121- PET FRIENDLY
- PET FRIENDLY
- PET FRIENDLYFURNISHED
- PET FRIENDLYTotal price$1,679 - $2,175/mo1-3 bd1-2 baRockledge at Quarry Bend | 903 E Cobblegate Dr,
Sandy, UT 84094 - PET FRIENDLY
- NEW - 1 DAY AGO
- NEW - 2 DAYS AGOPET FRIENDLY
- PET FRIENDLY
- PET FRIENDLY
- SENIOR HOUSINGPET FRIENDLYINCOME RESTRICTED
 SENIOR HOUSINGPET FRIENDLYTotal price$1,699 - $2,370/mo1-2 bd1-2 baCottages on 7th, a 55+ Community | 9206 S 700 E,
Sandy, UT 84070- PET FRIENDLYINCOME RESTRICTED
- PET FRIENDLY
 PET FRIENDLY
 See more homes for rent inSandy
Off Market Homes Near 1971 E Falcon Hurst Ct
 SOLDNOV 4, 2026Richardson Real Estate LLC
 SOLDNOV 4, 2026
- SOLDNOV 2, 2026
- SOLDOCT 29, 2026
 SOLDOCT 23, 2026
- SOLDOCT 23, 2026
- SOLDOCT 23, 2026
 SOLDOCT 22, 2026
- SOLDOCT 21, 2026
- SOLDOCT 21, 2026
 See more homes for sale inSandy
Homes for sale near 1971 E Falcon Hurst Ct
 OPEN SUN, 11-1PMEquity Real Estate (Solid)
 Summit Sotheby's International Realty
 Presidio Real Estate (River Heights)
- See more homes for sale inSandy


- Results are loading