


11265 S 73rd Pl E
Bixby, OK 74008
 4 Beds
 4 Baths
 4,534 sqft
$593,400
as of Jul 5, 2026
$593,400
as of Jul 5, 2026
4 Beds
4 Baths
4,534 sqft
Local Information
- Map ViewExplore the area around 11265 S 73rd Pl E.

- Schools1 Preschool School2 Elementary Schools1 Middle School1 High School

- Shop & Eat

-- mins to
Description
- Fabulous Executive home on cul-de-sac in desirable Woodcreek. Hardwoods thruout.Office, Granite kitchen w/impressive island SS appliances & walk-in pantry. Great room w/2 story vaulted ceiling, elegant stone FP, staircase & balcony w/gorgeous iron railings. Separate theater room, large game room, Master suite. Second bedroom w/Private bath down. Huge Laundry room w/sink. Large east facing covered patio. Neighborhood pool, playground, close to shopping. Bixby Schools
(RLNE5047459)
(RLNE5047459)
11265 S 73rd Pl E, Bixby, OK 74008 is a 4 bedroom, 4 bathroom, 4,534 sqft single-family home built in 2007. It last sold for $515,000 on Nov 18, 2021. More recently, it was listed as a rental in July 2020 with an asking price of $3,250 per month. That rental listing was removed on July 18, 2020. It is currently off market. The Trulia Estimate is $593,400, with a rent estimate of $3,401/month.
Home Highlights
Parking
Garage
Outdoor
No Info
A/C
Heating & Cooling
HOA
None
Price/Sqft
No Info
Listed
Less than a day ago
Home Details for 11265 S 73rd Pl E
|
|---|
Heating & Cooling Heating: Forced Air, Electric, GasAir ConditioningCooling System: CentralHeating Fuel: Forced Air |
Levels, Entrance, & Accessibility Stories: 1.5Floors: Tile, Hardwood |
Interior Details Number of Rooms: 13Types of Rooms: Laundry Room |
Appliances & Utilities DishwasherDisposalMicrowaveRefrigerator |
Fireplace & Spa Fireplace |
|
|---|
Exterior Home Features Roof: CompositionExterior: Other, BrickFoundation Type: Slab |
Parking & Garage GarageParking: None, Garage |
|
|---|
Year Built Year Built: 2007 |
Property Type / Style Property Type: Single Family Home |
|
|---|
Lot Area: 9234 sqft |
|
|---|
On Site Laundry Available |
Price History for 11265 S 73rd Pl E
| Date | Price | Event | Source |
|---|---|---|---|
| 11/18/2021 | $515,000 | Sold | N/A |
| 07/18/2020 | $3,250 | ListingRemoved | Agent Provided |
| 07/01/2020 | $3,250 | Listed For Rent | Agent Provided |
| 08/05/2019 | $3,250 | ListingRemoved | Agent Provided |
| 07/24/2019 | $3,250 | Listed For Rent | Agent Provided |
| 04/19/2018 | $3,250 | ListingRemoved | N/A |
| 04/14/2018 | $3,250 | Listed For Rent | N/A |
| 06/13/2013 | $2,900 | ListingRemoved | N/A |
| 05/17/2013 | $2,900 | Listed For Rent | N/A |
| 06/27/2012 | $2,500 | ListingRemoved | N/A |
| 06/22/2012 | $2,500 | Listed For Rent | N/A |
| 12/09/2009 | $475,000 | ListingRemoved | Agent Provided |
| 06/13/2009 | $475,000 | Listed For Sale | Agent Provided |
| 07/26/2007 | $475,500 | Sold | N/A |
| 01/13/2006 | $78,000 | Sold | N/A |
Market trends in Bixby
Last updated May 2026
Avg. sale price
$374K
$37.08KMoM
Sale-to-List Price
98.2%
0.1%MoM
Price per sq ft
$160
$1MoM
Available listings
260
10MoM

- Results are loading
Property Tax and Assessment
| Year | 2025 |
|---|---|
| Tax | $8,421 |
| Assessment | $562,755 |
Home facts updated by county records
Comparable Sales for 11265 S 73rd Pl E
Address | Distance | Property Type | Sold Price | Sold Date | Bed | Bath | Sqft |
|---|---|---|---|---|---|---|---|
0.03 | Single-Family Home | $460,000 | 03/16/26 | 4 | 4 | 3,450 | |
0.06 | Single-Family Home | $515,000 | 08/12/25 | 5 | 4 | 4,069 | |
0.12 | Single-Family Home | $525,000 | 04/01/26 | 4 | 3.5 | 3,940 | |
0.06 | Single-Family Home | $475,000 | 11/14/25 | 3 | 3 | 4,068 | |
0.12 | Single-Family Home | $525,000 | 04/07/26 | 4 | 4 | 3,940 | |
0.13 | Single-Family Home | $477,500 | 05/28/26 | 5 | 3.5 | 3,994 | |
0.06 | Single-Family Home | $515,000 | 06/18/26 | 6 | 3.5 | 3,765 | |
0.19 | Single-Family Home | $460,000 | 08/27/25 | 4 | 3.5 | 3,652 | |
0.16 | Single-Family Home | $495,000 | 03/04/26 | 5 | 3.5 | 3,641 | |
0.20 | Single-Family Home | $536,500 | 06/20/26 | 4 | 3.5 | 3,505 |
Nearby homes
Get a sense of prices in the area by checking nearby homes. OFF MARKETCassandra Smith, Henry Hinds Realty, LLC
 OFF MARKETLindy Collins, McGraw, REALTORS
 OFF MARKETBill Fiore, Chinowth & Cohen
 OFF MARKETCaryl Kirtley, McGraw, REALTORS
 SOLDMAR 16, 2026Josh Rainwater, Coldwell Banker Select
 SOLDNOV 14, 2025Victor Guadarrama, Key Solutions Real Estate LLC
 OFF MARKETEnrique Guadarrama, Key Solutions Real Estate LLC
 OFF MARKETLaura Grunewald, McGraw, REALTORS
 OFF MARKETPatty Taylor, McGraw, REALTORS
 OFF MARKETJennie Wolek, Keller Williams Advantage
 OFF MARKETCarri Ray, Trinity Properties
 OFF MARKETEmma Wagoner, Platinum Realty, LLC.
Assigned Schools
These are the assigned schools for 11265 S 73rd Pl E.
- Bixby High School
- 9-12
- Public
- 2496 Students
9/10GreatSchools RatingParent Rating AverageI moved my family down here almost 3 years ago. My child got caught with a vape in the 9th grade and no that is not okay to be doing but she sat there and got bashed my teachers, higher upper administrators, and even the school PO’s about it she was 14 years old at the time. You are supposed to be encouraging them not bashing them for what they are doing. The teachers are not good at managing there students when they are acting out in class. I even had my child tell me that one of her teachers makes very rude comments to his students and said he’s just joking. My other child has gotten dress coded many times since she has gotten bigger in the chest and when i go to the school i see office ads or just students coming in and out of the office wearing booty shorts and short crop tops. If you are going to dress code one girl you need to dress code the rest of them. And the principles of the high school pick and choose and they give unfair punishment to the kids even if it’s for the same behavior or situation. And the kids there are just flat out rude. If you aren’t rich, popular, a teachers pet, or a administrators child you might as well be thrown out to the garbage. My children have been bullied, rumors have been spread, they have been talked about constantly. They say they have a “no bullying policy” but they don’t handle it when it does come to bullying. Do better Bixby.Other Review9mo ago - Bixby Middle School
- 7-8
- Public
- 1325 Students
7/10GreatSchools RatingParent Rating AverageExcellent STEM program and rigorous academics. We moved from Jenks to be in the Bixby school district due to smaller class sizes, better funding per student, and teacher credentials/certifications. We have known several families with kids in this school system that have gone on to top 20 colleges and several Ivy Leagues. The quality of education you will find in this school is superb. Attentive staff and administration that supports great character, education, and growth.Parent Review6mo ago - Bixby North Elementary
- PK-3
- Public
- 631 Students
9/10GreatSchools RatingParent Rating AverageWe are a Japanese family and teachers give a huge help and support to our daughter to improve her English. There is no isolation but a family atmosphere. Events with a lot of fun are organized. We are very happy with the school and teachers.Parent Review1y ago - Bixby North Intermediate
- 4-6
- Public
- 501 Students
8/10GreatSchools RatingParent Rating AverageI have 4 kids within the Bixby school district, 3 going to North and one in Middle school currently. We moved out of Tulsa Public Schools and Union, and I've couldn't be happier that we did. By buying a house in Bixby School district, was the greatest change we could have made for our children. They have gone above and beyond all expectations we had. The faculty truly cares about their students, and it shows within the students!Parent Review1y ago  Check out schools near 11265 S 73rd Pl E.
What Locals Say about Bixby
At least 151 Trulia users voted on each feature.

93 % Say car is needed

89 % Say parking is easy

87 % Say it's dog friendly

87 % Say yards are well-kept

83 % Say kids play outside

81 % Say it's quiet

74 % Say people would walk alone at night

73 % Say there's holiday spirit

62 % Say there are sidewalks

57 % Say neighbors are friendly

56 % Say there's wildlife

49 % Say they plan to stay for at least 5 years

47 % Say streets are well-lit

38 % Say there are community events

34 % Say it's walkable to grocery stores

29 % Say it's walkable to restaurants
Sourced by Trulia users. Learn more about our methodology.
LGBTQ Local Legal Protections
LGBTQ Local Legal Protections

Apartments for Rent
 NEW - 1 DAY AGOPET FRIENDLY
 PET FRIENDLY
 PET FRIENDLY
 PET FRIENDLY
 See more homes for rent inBixby
Explore by feature - Pet Friendly
 SPECIAL OFFERPET FRIENDLY
 APPLY INSTANTLYPET FRIENDLY
 NEW - 2 DAYS AGOAPPLY INSTANTLYPET FRIENDLY
 APPLY INSTANTLYPET FRIENDLYFURNISHED
 APPLY INSTANTLYPET FRIENDLY
 PET FRIENDLY
 PET FRIENDLY
 NEW - 2 DAYS AGOPET FRIENDLY
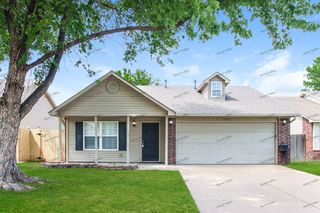 PET FRIENDLY
 PET FRIENDLY
Explore by feature - Garage
- APPLY INSTANTLYPET FRIENDLY
- NEW - 2 DAYS AGOAPPLY INSTANTLYPET FRIENDLY
- APPLY INSTANTLYPET FRIENDLYFURNISHED
- APPLY INSTANTLYPET FRIENDLY
- PET FRIENDLY
- PET FRIENDLY
- PET FRIENDLY
- NEW - 2 DAYS AGOPET FRIENDLY
 PET FRIENDLY
 PET FRIENDLY
Explore by feature - Air Conditioning
- SPECIAL OFFERPET FRIENDLY
- APPLY INSTANTLYPET FRIENDLY
- NEW - 2 DAYS AGOAPPLY INSTANTLYPET FRIENDLY
- APPLY INSTANTLYPET FRIENDLYFURNISHED
- APPLY INSTANTLYPET FRIENDLY
- PET FRIENDLY
- PET FRIENDLY
- NEW - 2 DAYS AGOPET FRIENDLY
- PET FRIENDLY
- PET FRIENDLY
Explore by feature - Pool
- SPECIAL OFFERPET FRIENDLY
- NEW - 2 DAYS AGOAPPLY INSTANTLYPET FRIENDLY
- APPLY INSTANTLYPET FRIENDLY
- PET FRIENDLY
- PET FRIENDLY

 APPLY INSTANTLYPET FRIENDLY
 APPLY INSTANTLY
 PET FRIENDLY
Explore by feature - Washer/dryer
- SPECIAL OFFERPET FRIENDLY
- APPLY INSTANTLYPET FRIENDLY
- NEW - 2 DAYS AGOAPPLY INSTANTLYPET FRIENDLY
- APPLY INSTANTLYPET FRIENDLYFURNISHED
- APPLY INSTANTLYPET FRIENDLY
- PET FRIENDLY
- PET FRIENDLY
- NEW - 2 DAYS AGOPET FRIENDLY
- PET FRIENDLY
- PET FRIENDLY
Explore by feature - Outdoor Space
- SPECIAL OFFERPET FRIENDLY
- PET FRIENDLY
- NEW - 2 DAYS AGOPET FRIENDLY
 APPLY INSTANTLYPET FRIENDLY
 PET FRIENDLY
Homes for sale near 11265 S 73rd Pl E
 FOR SALE BY OWNER0.28 ACRES
 0.26 ACRESTammy Perry, McGraw, REALTORS
 0.29 ACRESMonica Castillo, Chinowth & Cohen
 0.41 ACRESJennifer Story, Keller Williams Preferred
 0.35 ACRESCrystal Edwards, Solid Rock, REALTORS
 Nicole Dawson, Engel & Voelkers Tulsa
 0.48 ACRESCarri Ray, Trinity Properties
 See more homes for sale inBixby


Off Market Homes Near 11265 S 73rd Pl E
 SOLDJUL 2, 2026Kelly Garrison, The Garrison Group LLC.
 SOLDJUL 2, 2026Suzanne Mobley, Coldwell Banker Select
 SOLDJUL 2, 2026Gannon Brown, MORE Agency
 SOLDJUL 1, 2026Ashley Wozniak, Coldwell Banker Select
 SOLDJUL 1, 2026Trish Ary, Keller Williams Advantage
 SOLDJUL 1, 2026Kristi Fuller, Ryon & Associates, Inc.
 SOLDJUL 1, 2026Summer Ratzlaff, Keller Williams Preferred
 SOLDJUN 30, 2026Jeb Perry, Coldwell Banker Select
 SOLDJUN 30, 2026Michelle Jansen, Coldwell Banker Select
 SOLDJUN 30, 2026Tim Stevens, Keller Williams Advantage
- See more homes for sale inBixby