If you asked 100 people to list the top three things they consider when looking for a place to live, I bet a good portion of them would respond, “Location, location, location.” At Trulia, we couldn’t agree more. We believe that what’s around a home is just as important as what’s in it, which is why we have dedicated Local Info pages. The pages contain a wealth of information – including market trends data and neighborhood insights – to help you learn what it’s really like to live in a certain city or neighborhood.
While everyone at Trulia has worked hard to source and surface this information since day one (way back in 2005!), the data hasn’t always been presented in the most succinct way. And, what good is data if it’s hard to digest? No good. So, last fall, a small cross-functional team set out to improve Trulia’s Local Info pages during our Q3 2015 Innovation Week, and we won!

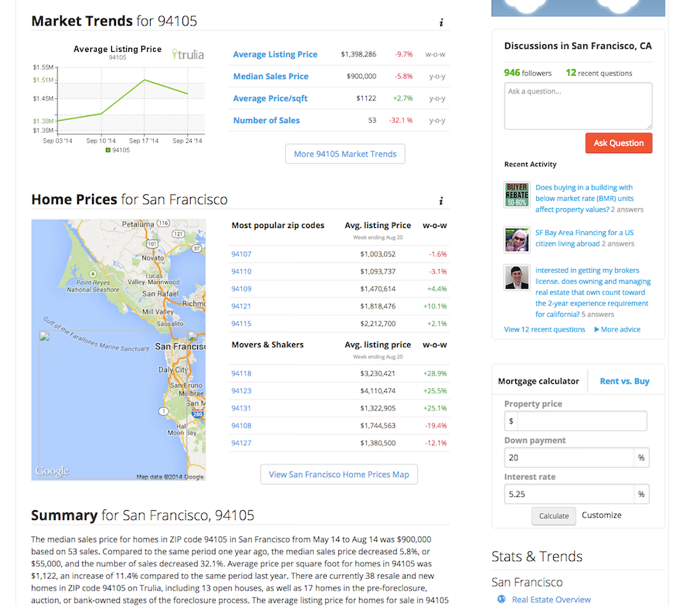
Old Trulia Local Info Page
In celebration of Trulia’s first Innovation Week of 2016 (officially kicking-off next week), and our new Local Info pages shipping (shipped last month), I want to give you a glimpse into what we did to make it all happen.
The project was led by Rhonda Friberg, a geospatial engineer on Trulia’s maps team. She pulled together a small team of front-end engineers, back-end engineers, designers, and product managers, and sold the team on her vision of how we could improve our Local Info pages, in just one week.
We knew we needed to set priorities so we could spend our time working on the right changes during Innovation Week, and here’s where we netted out:
Engineering
On the engineering side, our number one priority was streamlining how we surfaced the data. We removed direct database connections and added several new API endpoints to access listing prices, historical sales data, amenities data, school data, crimes data, and demographics data. As a result, we were able to reduce page load time, reduce time needed for future improvements, and generally increase the quality of life for the engineers who work on these pages.
Design
Design was also quite important. We wanted to design reusable components so we could easily integrate local info into other product touch points. We also made a design decision to update the map as users scroll down the page. For example, when crimes data is shown on the page, the map will show the corresponding crimes map layer. When school data is visible, the map automatically shows the schools map layer. (This is actually my favorite feature on the page because it helps users discover more information in an easy to digest way.)
Product
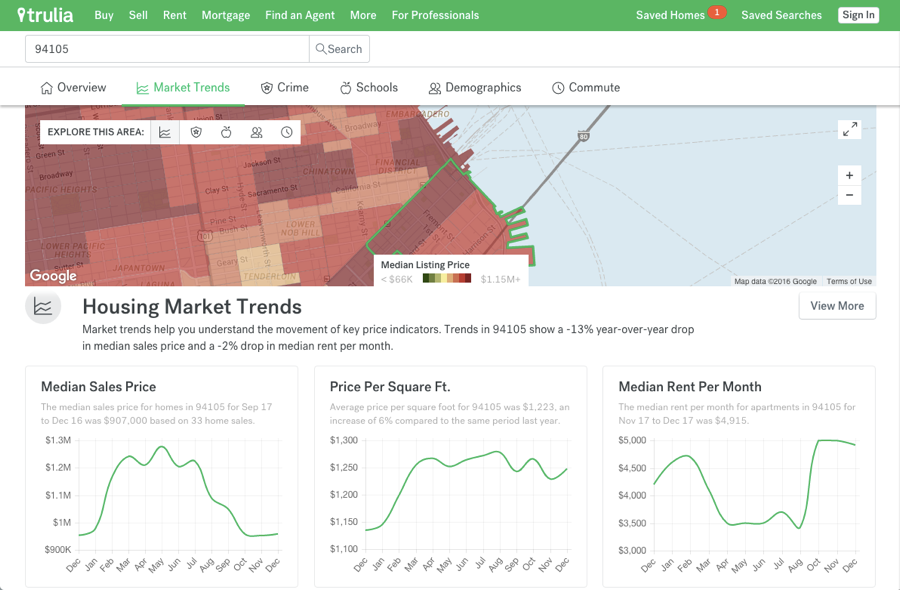
On the product side, our number one goal was to make the data easier to interpret. We wanted to give users a feel for a particular location using the data we already have. Trulia’s map layers are super awesome (check out our full set of map layers here) and we thought we could make them even better if we called out key pieces of data for each layer. For example, understanding how much it costs to live in a particular location is important, so we put these pricing stats at the top of the new page to really help bring the data to life, as seen here:

New Trulia Local Info Page
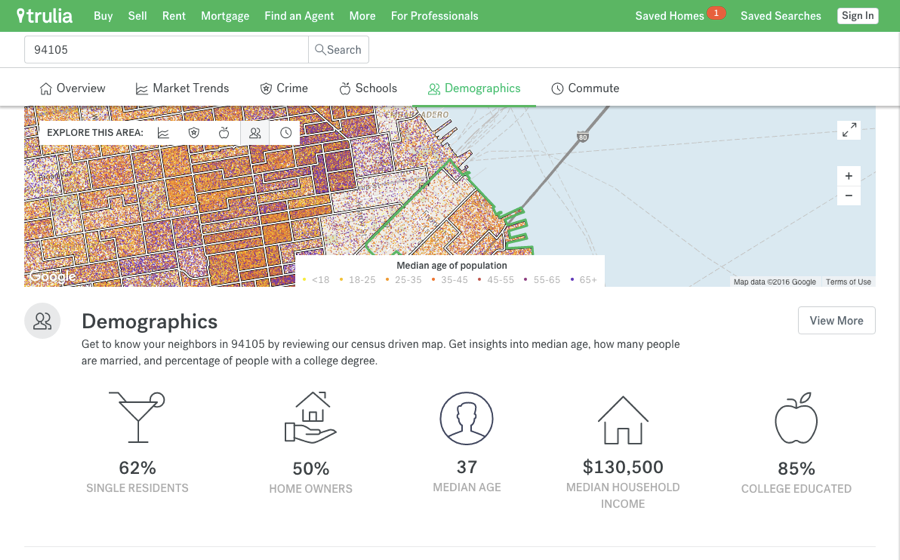
Here’s another example, where we chose to highlight five key stats from the demographics map layer. As you can see, our office zip code has a median age of 37, with 62 percent of the residents being single:

New Trulia Local Info Page
Because our project won the 2015 Q3 Innovation Week, we were given the green light to polish our work for production. It was pretty awesome to see what the team accomplished in one week and it’s even more awesome to see our work totally shipped. The team’s hard work is now live for all consumers to experience – check out your city today!


