Whether you’re buying or renting a home, it’s important to get a sense of what it’s like to live in the neighborhood before you move in. The typical amenities, such as restaurants, shops, schools, and grocery stores are relatively easy to look up. What’s not as obvious is how noisy it gets.
We at Trulia have always been interested in the noise levels through time of any given property in the country. However noise is something difficult to capture from various data sources. An airport might be noisy and the neighborhoods surrounding it will be affected by the noise, but are they all affected equally? The answer is no. Take off and approaches have different noise levels and trajectories and certain neighborhoods on a given side of a major airport are likely to have vastly different average noise levels. Likewise construction noise, ambulances, even ice cream trucks have varied and even seasonal noise level contributions.
So we took it upon ourselves to think about another way to look at noise: how many people are actually complaining about it and where are they located? Now, this approach admittedly has its flaws: there could be serial noise complainers, the data could be skewed by population, or there could be reporting biases. Regardless, if there were enough data, wouldn’t it be cool to see what it looked like?
Enter CartoDB and its awesome spatial-temporal visualization tools. We pulled police data on noise complaints from the City of Seattle, New York, and San Francisco for as far back as feasible. This resulted in about 5 years worth of data for each city. We think the maps are fun, interesting, and probably close to spot on.
Where It Sounds Like Teen Spirit in Seattle
The Capitol Hill and the University District in Seattle are quite dense in noise complaints. No huge surprise there. Click here to see the full animated map for Seattle.

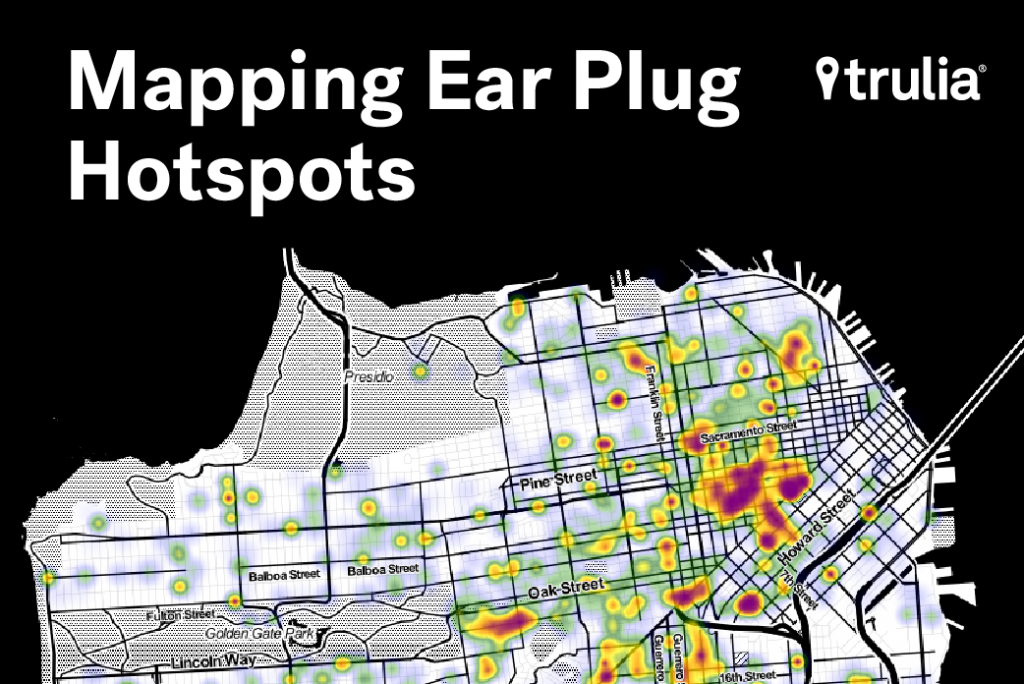
Do Not Enter Sandman in These San Francisco Neighborhoods
In San Francisco, the Tenderloin is obviously a hotbed of noise complaints, as is the Upper Haight, The Mission, and North Beach. Click here to see the full animated map for San Francisco.

No Sleep Till Brooklyn
New York City is a bit trickier to interpret, as the noise complaint density seems evenly spread. Click here to see the full animated map for New York City.

Interestingly, some of the data is incredibly detailed and allows us to pull out specific types of noise complaints. In New York, for example, we can see the pattern of ice cream truck related noise complaints as well as barking dogs and construction.


We hope you enjoy these maps as much as us and find them interesting and relevant.