This post is a continuation of our series about paying down technical debt and re-architecting our platform. You can read the introductory post here: Paying Technical Debt to Focus on the Future.
Monitoring Trulia’s infrastructure was an important consideration during our transition from a monolithic codebase to a microservices architecture, which we refer to as Islands. We needed to monitor mission-critical signals, such as cluster health and performance, host-based metrics, Kubernetes-native metrics, application metrics, and more. Our team was challenged with organizing this data in a meaningful way to visualize trends, perform troubleshooting, and alert developers when issues arise with their applications or the underlying infrastructure. Our implementation of Prometheus and its AlertManager provides the observability we need.
Prometheus
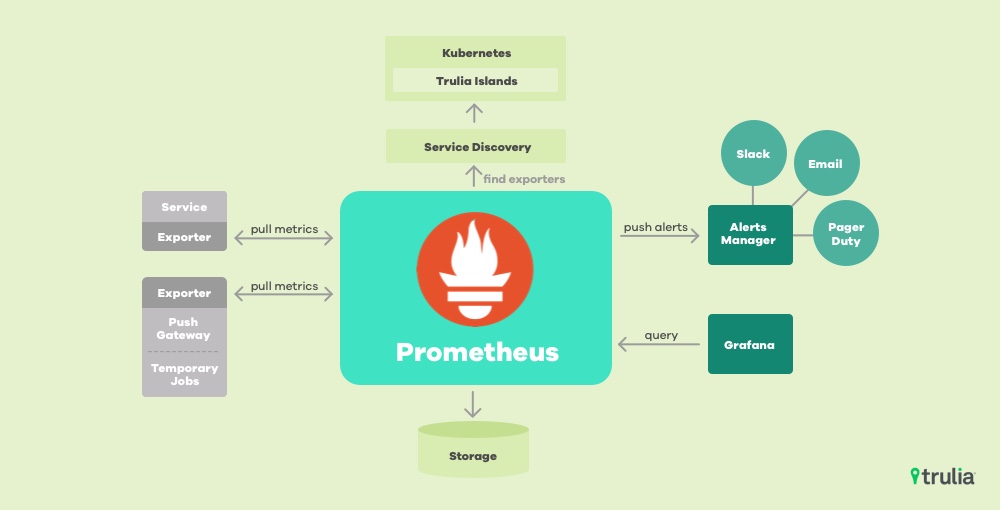
Our team chose Prometheus, a monitoring and alerting toolkit, as our central hub for collection and storage of the time-series data we use to observe the state of our Kubernetes clusters. Prometheus was originally created at Soundcloud in 2012, and later became an open-source project. It was one of the first projects to join the Cloud Native Computing Foundation, and is now considered a standard part of Kubernetes observability tooling.
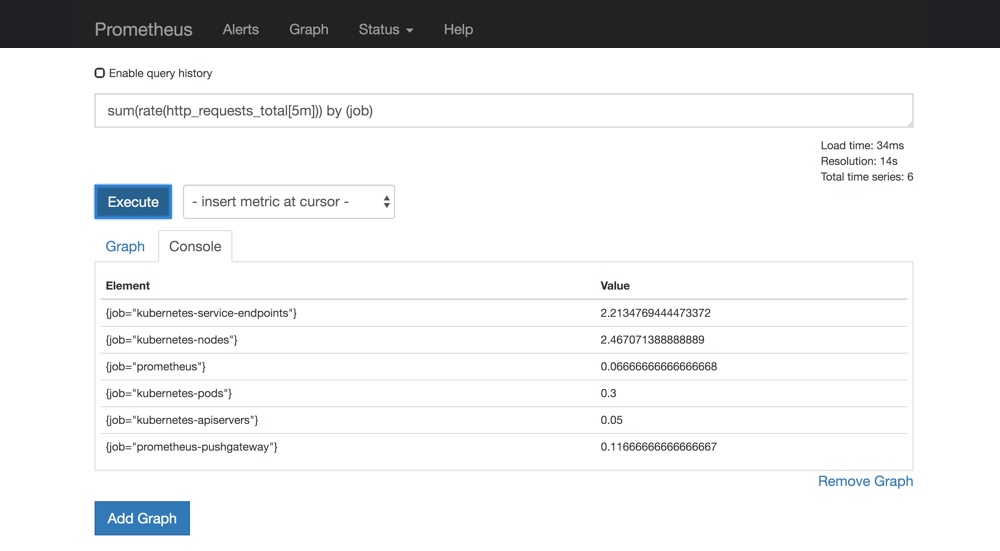
Prometheus server UI with PromQL query
Implementation
For the initial deployment of Prometheus, we started with the stable Helm repository. Helm is a package manager for Kubernetes. As we gained a better understanding of the role of Kubernetes monitoring components & APIs, we added customizations to the Helm deployment to fit our needs. The Prometheus UI and the Kubernetes-focused Grafana dashboards were helpful to get familiar with PromQL, the Prometheus-specific query language. We tested our customizations on short-lived Kubernetes clusters, and used Google’s Site Reliability Engineering Handbook and community best practices to help with identifying the most relevant signals to utilize for monitoring the cluster.
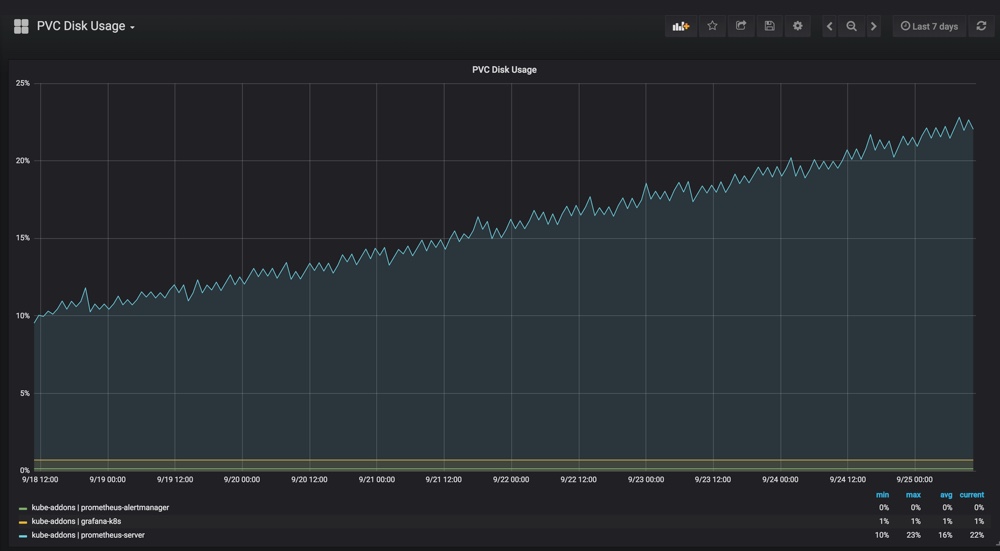
Grafana dashboard
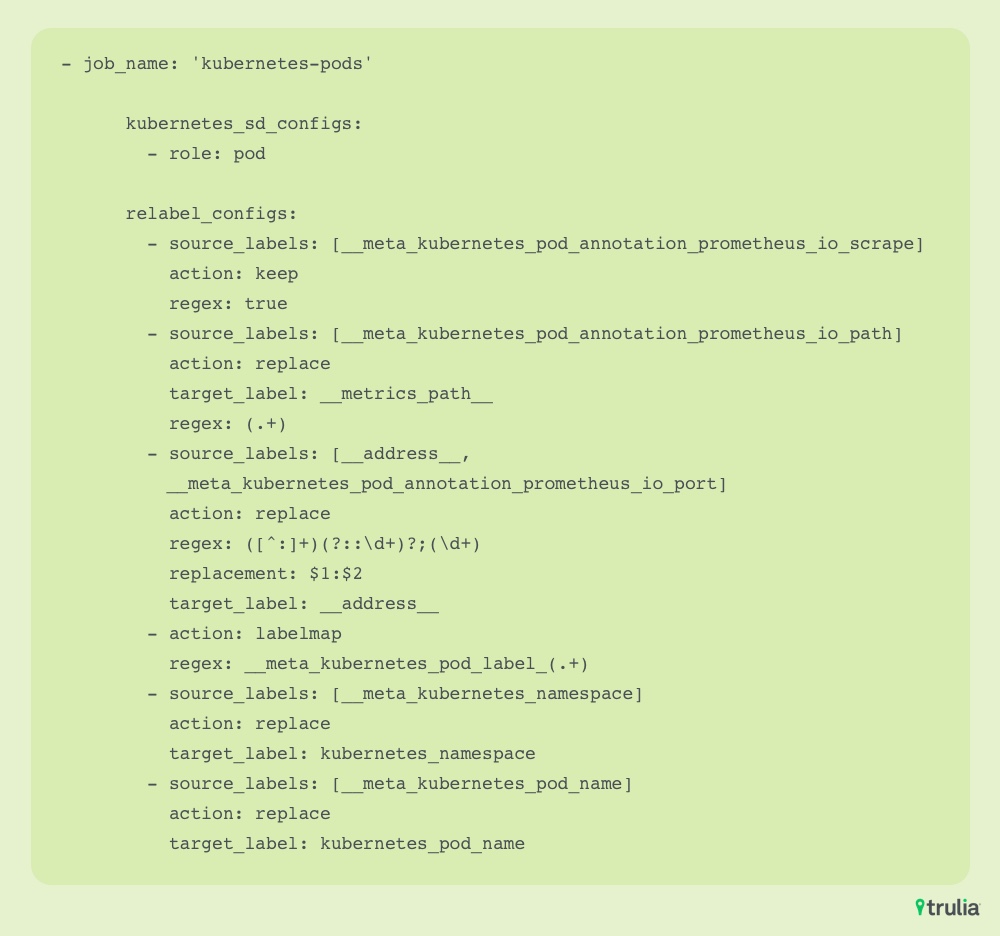
Prometheus scrape configuration for Kubernetes pods
Alertmanager
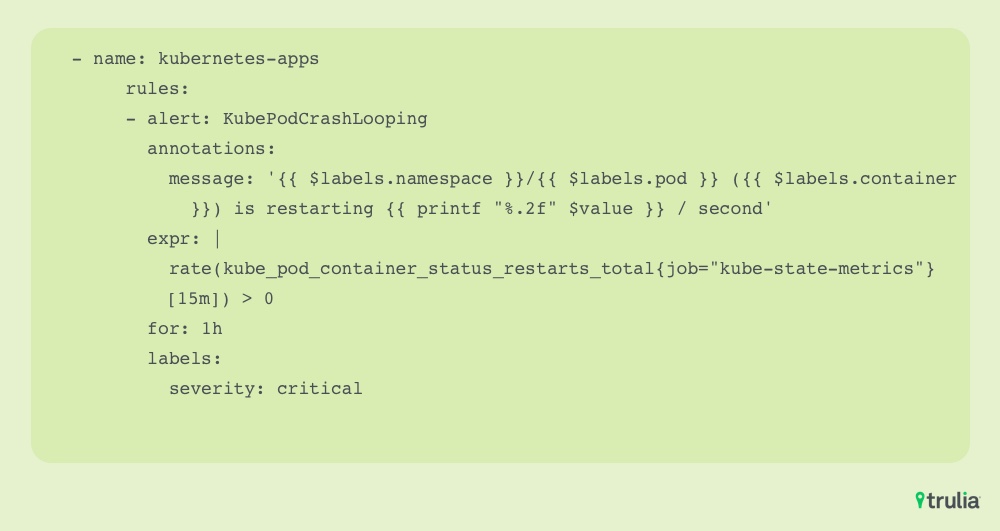
Alert rule configuration
Collection, storage, and visualization of metrics for a complex system is a great foundation, but this is significantly improved by the capability to set alert rules for non-optimal conditions and to notify stakeholders when things go wrong. This is where Alertmanager, part of the Prometheus toolkit, comes into play. By processing and routing alerts fired according to the rules we configured, notifications are sent to various receivers, such as Slack, PagerDuty and email. Alertmanager also offers capabilities for muting and inhibiting alerts, which helps engineers avoid being overloaded with alerts during system troubleshooting or maintenance.
Key Learnings & Challenges
There is a robust ecosystem of observability tools, including client libraries for application instrumentation, specifications for time-series data collection (scrape configurations) and exporters for existing services (such as PostgreSQL, Redis and HAProxy), but not all of these are equal in terms of maturity and ease of use. We had to become comfortable with the rapid pace of evolution in the tooling. Helm charts are constantly evolving, and are not always stable enough for production use. For current cluster deployments, we selected a specific Helm chart version that met our needs and worked with our customizations.
The Way Forward – Prometheus Operator
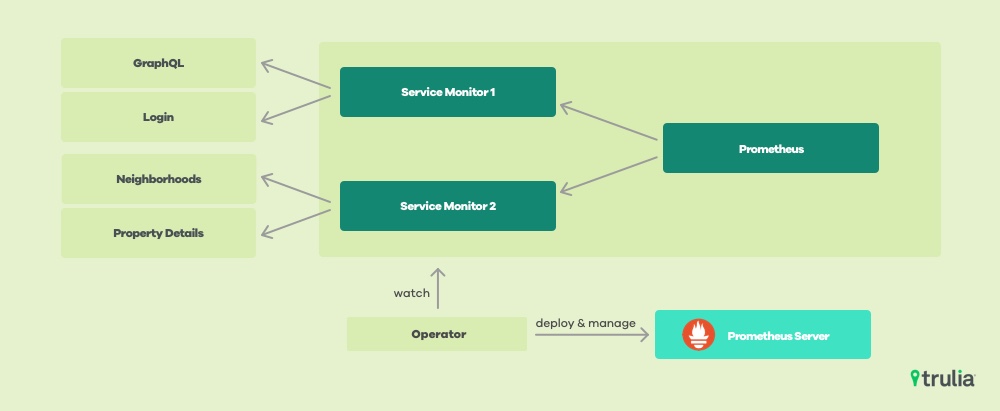
We’re in the early stages of testing end-to-end monitoring using Prometheus Operator, which offers a more streamlined and declarative approach to configuration, alerting and high-availability for Prometheus, Alertmanager, and Grafana. Prometheus Operator will also simplify adding new targets to monitor with Prometheus, using service monitors. We are also focused on testing the using Operator with the Prometheus adapter. This provides custom metrics to scale the number of pods for various workloads, using the Kubernetes horizontal pod autoscaler (HPA). This approach provides more accuracy and flexibility than simply scaling pods based on CPU usage.
Though it is still early on in our move to Trulia Islands, it’s clear we have made the right choice with Prometheus. With the help of this versatile observability toolkit, we can translate mountains of cluster and infrastructure data into insights that empower our teams to take action quickly and ensure visitors to our site and apps have a positive experience finding a place they’ll love to live.
Stay tuned for future posts about our move to Islands, and check out the Trulia Tech and Innovation blog for previous posts that explore our app shell, use of GraphQl, and work with Istio in detail.