Co-Authored by Alex Colburn, Principal Applied Scientist, Zillow Group
In a previous post we shared how Trulia leverages computer vision and deep learning to select the hero image for listings on our site. Today we’d like to share how we’ve extended this technique to extract salient thumbnails from 360-degree panoramas of homes.
The development of automatic panorama generation in modern cameras has made 360-degree images ubiquitous. They are widely used in multiple industries, in everything from Google Street View, to virtual reality (VR) films. Last year, Trulia’s parent company Zillow Group, released 3D-Home, enabling users to upload and share 360-degree panoramas of their listings. Compared to traditional photography, 360-degree panoramas create an immersive experience by providing a complete view of the room.
This capability has added value for home-buyers who can see a room and home from all angles, not just what the photographer chose to highlight. However, given the wide field of view, it is easy for the viewer to look in the wrong direction. This creates a need for a mechanism to direct viewers attention to the important parts of the scene. This is particularly true in the context where the 360-degree panoramas need to be represented as a static 2D image as shown below in Figure 1. Here we ensure that these 360-degree panoramas are discoverable and engaging to the user by identifying the most salient viewpoints within the panorama.
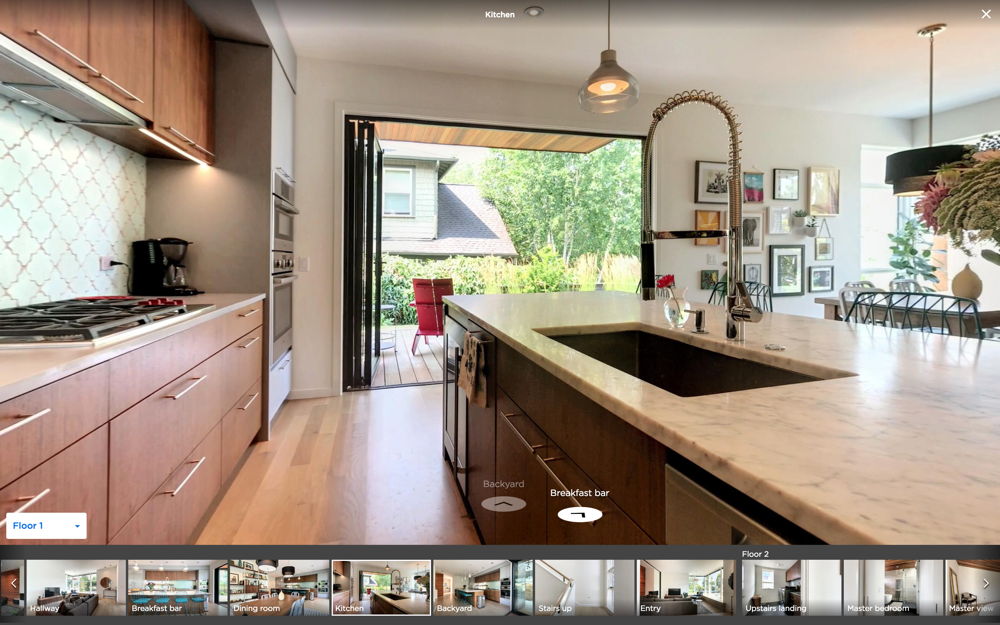
Figure 1. A screenshot of the 3D home user experience.The thumbnails in the bottom row help viewers get a sense of the important and salient aspects of each panorama.
Zillow Group 3D Home
With the release of the Zillow 3D Home last year, agents and sellers can capture 360-degree panoramas of a home and add them to their listing on Trulia or Zillow. The app guides the users through the capture process and then uploads these panoramas to ZG servers. If you are interested to know more on how we use computer vision techniques to create panoramas and compose a rich 360-degree experience we encourage you to read our blog.
These panoramas help provide an immersive home viewing experience that isn’t possible with the standard, limited field of view 2D photos. Panoramas like these help agents and sellers attract more views to a listing.
In Figure 1 we show an example of how these panoramas look on our site. The entry point to each panorama is marked with a salient thumbnail designed to provide an informative view of each panorama. Such a thumbnail can help increase the chances of a user to engage with the content and enter the 360-degree experience.

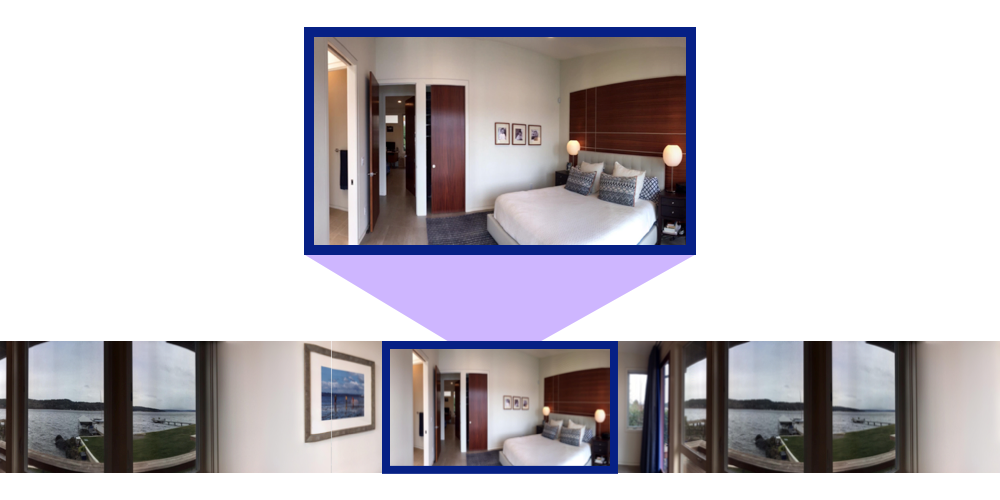
Figure 2. A 360 degree real estate panorama with 60 degree vertical field of view.
Characteristics of a Salient Thumbnail
Salient thumbnails are visually informative and aesthetically pleasing viewpoints of a spherical 360-degree panoramic image. We define salient thumbnails as having three key characteristics, they must be representative, attractive, and diverse.
- Representative: A salient thumbnail should be informative and representative of the visual scene being captured by the panorama.
- Attractive: A salient thumbnail should capture aesthetically pleasing viewpoints within a scene.
- Diverse: If multiple salient thumbnails exist, they should capture different viewpoints within the scene.
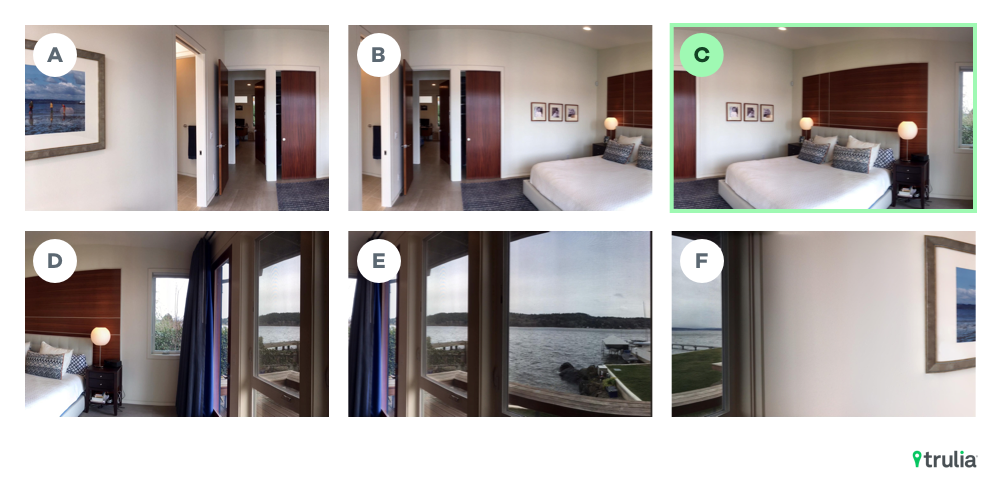
Figure 3. Extracted 2D viewpoints from the above panorama. Viewpoint C is selected by our algorithm as the salient viewpoint while Viewpoint D represents the thumbnail generated by the baseline approach. Viewpoint C is able to provide a representative view of the scene while being more aesthetically pleasing and relevant than other viewpoints.
Generating Thumbnails
An initial approach to generating a thumbnail would be to simply extract a single viewpoint in the hope that it will result in a salient thumbnail. However, this presents certain challenges.
Panorama images represent 360 degrees of horizontal view and 180 degrees vertical view resulting in a 2:1 aspect ratio. In some instances like in Figure 2, an image may have a limited vertical field of view and require padding with zero values, or black pixels to maintain the aspect ratio.
We could extract the central viewpoint in the panorama, which often corresponds to the direction in which the camera was facing when the capture process began. However, this approach is reliant on user starting with a representative viewpoint in order for it to be salient.
Furthermore, we cannot simply crop a rectangular section from a panorama image. Unlike 2D images, panoramas are spherical, simply cropping the central viewpoint leads to thumbnails which have spherical artifacts, e.g. straight lines look curved.
To extract a viewpoint from a spherical panoramic image, we project the panorama into a 2D image with a specific Field of View, 3D orientation, aspect ratio, and viewport size as shown in Figure 4.
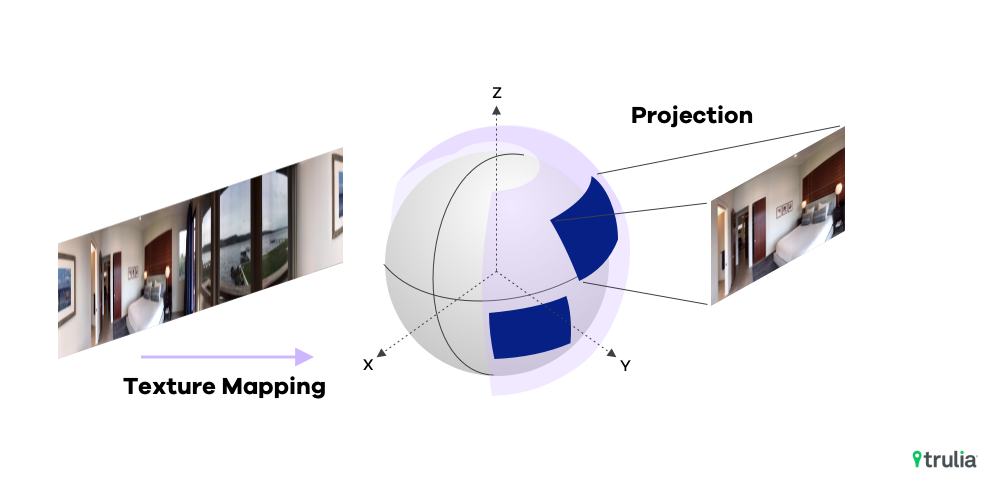
Figure 4. Extracting perspective images from 360-degree spherical panoramas.
While this addresses the spherical artifacts, thumbnails extracted from the central viewpoint can often be unrepresentative of the scene the panorama is trying to capture, as shown in Figure 3 above.
Generating Salient Thumbnails
To resolve this we needed an algorithm that ranks all the potential perspective thumbnails extracted from the panorama based on our defined saliency criteria. Below we list out some of the key components of our approach at extracting salient thumbnails.
Optimal Field Of View (FOV) Estimation:
Dedicated 360 cameras often offer full 180-degrees vertical Field of View (FOV). However, capture devices like smartphones often have a limited field of view. For example, a standard iPhone camera has a 60-degree vertical FOV. In such cases where the whole 180-degree vertical FOV is not present, it’s common practice to pad panorama images with zero value pixels as shown in Figure 2.
Due to these variations in vertical FOV, correctly estimating the vertical FOV before extracting the thumbnail images is paramount. Otherwise, we may be left with uncaptured regions surrounding a thumbnail image when estimated FOV is too large, or a significant loss of views in the vertical direction if the estimated FOV is too small.
To address this issue, for each panorama we identify the exact location of horizontal border lines that separate black regions from image regions and then use this location to obtain optimal FOV.
Computing Saliency Scores
Once the optimal FOV has been estimated, the system extracts 90 thumbnail images sampled uniformly at a horizontal view interval of 4 degrees from the panorama. The 4-degree intervals were empirically chosen to achieve a tradeoff between computational overhead and the ability to capture all diverse salient viewpoints within the panorama. These images or viewpoints are then ranked based on a saliency score. The viewpoint with the highest score is then chosen as the salient thumbnail.
Saliency Models
In order to compute a saliency score, we rely on three different Deep Convolutional Neural Networks (CNN) models that we briefly covered in a previous post. Each of these models are trained on a different dataset and help capture the various characteristics of a salient thumbnail.
Scene Model: This model helps capture the representativeness of a viewpoint to the panorama. Since we are capturing real estate panoramas, viewpoints that are categorized as relevant scenes like the kitchen or living room are considered more representative than viewpoints that focus on objects or non-scene related views like blank walls, windows, or chandeliers. This model is trained to categorize over 60 different scene classes commonly found in real estate photos.
Attractiveness Model: This model captures the visual attractiveness of a viewpoint. Viewpoints that are pointing to un-attractive regions of the panoramas or have low visual quality (blurry, dark, etc) are penalized, while viewpoints that are attractive and aesthetically pleasing earn a higher score. Training such deep learning models often require large amounts of data. In general, in our datasets we have found that luxury homes often have high quality, professionally staged, and aesthetically pleasing photos, while fixer-uppers sometimes have low quality, poorly captured images. Hence we use the predictions from another ML classification model that uses property features like price, location, property description, etc to categorize properties as Luxury or Fixer and then use it to label images from those properties as either Attractive (if it belongs to a Luxury property) or Not-Attractive (if it belongs to Fixer Upper). This allows us to train a deep learning model for image attractiveness on millions of images without the need of expensive data collection.
Appropriateness Model: This binary classification model helps to differentiate between relevant viewpoints like views of a bedroom from irrelevant views like walls, macro objects, pets, humans, text, etc. Along with the scene model, this model is used to quantify the representativeness and relevance of a viewpoint to the panorama.
Each of the candidate thumbnails/viewpoints are processed by the above deep learning models to generate three distinct scores. The saliency score is then defined as the weighted sum of three scores obtained from the scene, attractiveness, and appropriateness models.
Smoothing Model Outputs
Since our deep CNN models are trained on 2D images that are sampled from real estate listings, they can be susceptible to errors when applied to 2D image frames extracted from continuous streams like video or 360-degree panoramas. One potential reason for this is the bias introduced by training data where 2D images do not fully represent the distribution of all potential viewpoints that can be extracted from a 360-degree panorama.
This sampling bias during training and testing can cause the above deep CNN models to generate non-smooth outputs across adjacent frames. This is a general problem with deep networks and we plan to address it in our future versions by tuning these networks to produce smoother outputs across adjacent viewpoints.
To make our algorithm more robust and accurate to the aforementioned artifacts, we apply a smoothing function, in this case, Gaussian Kernels, to the probability outputs of individual classes for these deep models along horizontal sampled viewpoints. This smoothing ensures that the model predictions do not change drastically across adjacent viewpoints.
Scene type dependent weighting
As mentioned earlier, the scene model helps us to quantify the representativeness of a viewpoint. For example, a thumbnail image with a scene type of living room should be preferable to a thumbnail with a scene type of wall. To achieve this we associate a preference weight for each scene type. In general, scene types such as living room, bedroom, dining room and kitchen should have higher weights than scene types such as a window, door, or wall. The representativeness score of a thumbnail is then computed as the product of the predicted probability of that scene type and the preference weight of that scene class.
Introducing Diversity
While the use case we showed above (Figure 1) requires one salient thumbnail per panorama, the algorithm supports returning multiple salient thumbnails. This is relevant in scenarios where the application might want to provide multiple salient viewpoints like with a panorama summary that uses an image collage, or where more than one salient viewpoint exists, for example a panorama capturing an open floor plan with viewpoints of both the living room and kitchen.
When choosing multiple salient thumbnails, it’s important to consider diversity in the top N salient thumbnails that are returned to the user. In this case, we introduce diversity by ensuring that the selected horizontal viewpoints are well separated from each other. To achieve this, we first score all the viewpoints using the algorithm described above and then rank them by their saliency scores. After selecting the top salient thumbnail, the next salient thumbnail is chosen among thumbnails that have at least 30 degrees of separation in horizontal views compared to the already selected thumbnails. The same principle continues until either top N salient thumbnails have been selected or no more thumbnails are left that satisfy the above condition.
Evaluation through Human Judgement
Now that we have a model, how do know if it actually works? It is one thing to test a model against a labeled ground truth test set, and an entirely different thing to learn how humans perceive the results. In order to test with humans we performed a series of qualitative and quantitative experiments.
We used a total of 137 panoramas to evaluate the performance of the new algorithm compared to the baseline algorithm which simply extracts the central viewpoint. A total of 50 Amazon MTurk workers participated in the evaluation.
For each panorama, we show to the users three images: the original panorama, a thumbnail image using the baseline algorithm, and a thumbnail image using the new algorithm. Each worker is then asked to choose which thumbnail image from two candidates he/she prefers, as well as whether the worker strongly prefers or slightly prefers their selected thumbnail image
To ensure order doesn’t bias results we randomly shuffle the order in which the thumbnails from the two algorithms are displayed for a panorama. To ensure crowdsourcing quality, we also randomly inject benchmark or gold standard images into the experiments to track and monitor worker quality.
Overall results of the experiments showed a statistically significant improvement for our new algorithm when compared to the baseline algorithm. (Table 1)
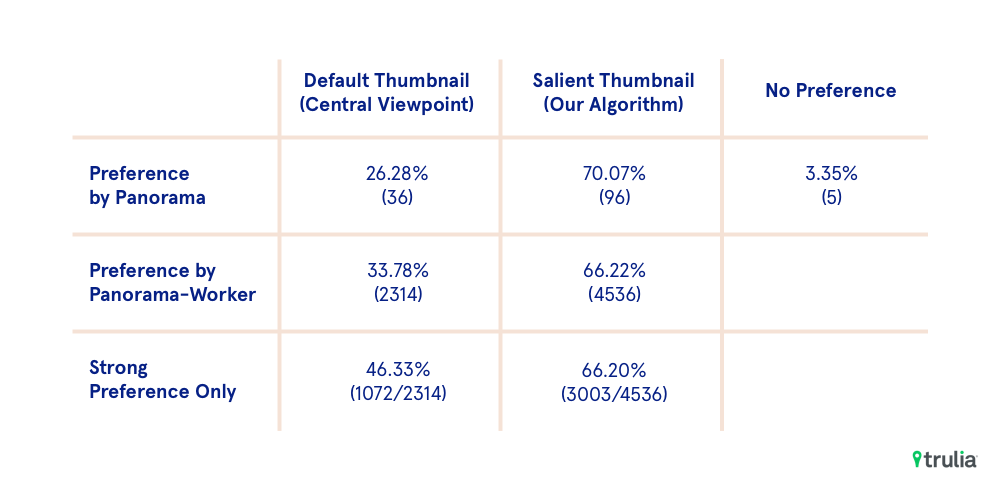
Table 1: Results from the human evaluation. Each panorama was shown to 50 users. For ~70% of the panoramas, majority of the users preferred salient thumbnail over the default one. In terms of overall votes, ~66% preferred the salient thumbnail over default thumbnail, out of which ~66% were strong preferences.
Deployment to Production
To deploy these models we leverage our ML framework for deploying deep learning models at Trulia that we described in our previous post.
We expose the thumbnail generation service as a Rest API on top of our ml platform. The API allows the client applications to query the service with a thumbnail image and optional parameters like desired aspect ratio, height, width, number of diverse salient thumbnails to be extracted, etc. The service then asynchronously computes the desired number of diverse salient thumbnails and returns them to the client via s3 or as a base64 encoded image via sqs.
Note that each panorama can have large number of potential viewpoints. For example, sampling per degree of horizontal view, while keeping other parameters constant, can lead to 360 distinct viewpoints to score. Even though the service is deployed on GPU instances and our CNN models can compute saliency scores per viewpoint within milliseconds, sampling and scoring all potential viewpoints can soon become computationally expensive given our low latency requirement for the thumbnail generation service. Furthermore, many of these viewpoints will have significant overlap and do not provide diverse enough scores to justify the additional overhead. Through our experiments we have found extracting 90 thumbnail images, uniformly at a horizontal view interval of four degrees each, to be a good balance between recall (capturing a salient viewpoint) of the algorithm and overall latency of the service.
Going Forward
The above results demonstrate the value of leveraging deep learning to extract salient thumbnails from 360 degree panoramas. Going forward we will improve upon this approach. First we’d like to develop a better understanding of saliency based on user feedback. We can capture user preferences to candidate thumbnails suggested by the model, and use that as a training signal for our models. Second, instead of training 3 different models on disjoint datasets to define saliency, we will like to move toward a single end-to-end cnn architecture to model saliency of an extracted thumbnail.
Stay tuned for future posts on how Trulia is leveraging AI and ML to help consumer discover a place they’ll love to live.
