
Retailers are set to slash prices on the day after Thanksgiving to lure shoppers looking for bargains during the holiday season. But what about for homebuyers seeking their own Black Friday deals? Well, the news isn’t good. Real estate Santa isn’t coming – for a while.
That’s because the late summer is actually the best time to find price cuts for homes. In this edition of our biannual cut-rate housing report, we seek the homebuyer’s equivalent of Black Friday. We found that while price cuts are still being used to move homes off the market at an increasing rate when adjusted for seasonality, the late-fall and early-winter months are when you are least likely to see a for-sale listing’s price come down.
We checked back in on how often for-sale homes are seeing their listing prices being cut and by how much, and also took a closer look at how much seasonality plays into the price-cut equation.
Here’s what we found:
- Price cuts are most common from May through October and are the rarest in December: Looking at 6 years of data, home price cuts are the most common just as peak home buying season is beginning to wane in August with 13.9% of all listings seeing a price cut. It is the least common in December with only 8.3% seeing a price cut.
- The share of for-sale listings with price cuts nationally increased to 13.4% from 13.1% during the year ending October 2017 and fifty-seven of the 100 largest metros saw the share of for-sale listings with a price reduction increase during the same time.
- Nearly one in five listings in Phoenix saw at least one price reduction during the year ending October 2017, the highest of the largest metro areas. San Francisco had the fewest at only 6.3%, down from 7.6% the previous year.
- Baton Rouge saw the biggest jump from last year, increasing by 3.5 percentage points to 15.1% while San Jose, Calif. has seen largest decline in price cuts, going from 9.9% of listings last year to 7.2% this year.
‘Tis the Season for Steady Pricing
Looking back at years of data, an obvious seasonality emerges in the rate at which sellers turn to price cuts. In August, as peak home buying season is winding down, one out of 7 listings (13.9%) will see a price cut. It’s “Black Friday” for homebuyers. The cuts are likely driven by sellers who have sat through the summer months waiting for a buyer and don’t want to keep waiting into the fall and winter months as selling activity declines in most places. By the time December rolls around, only one in 12 listings, or 8.3%, will see a price cut. By this time, most sellers and agents are holding out hope for renewed interest in early spring as potential buyers ramp up their searches again.
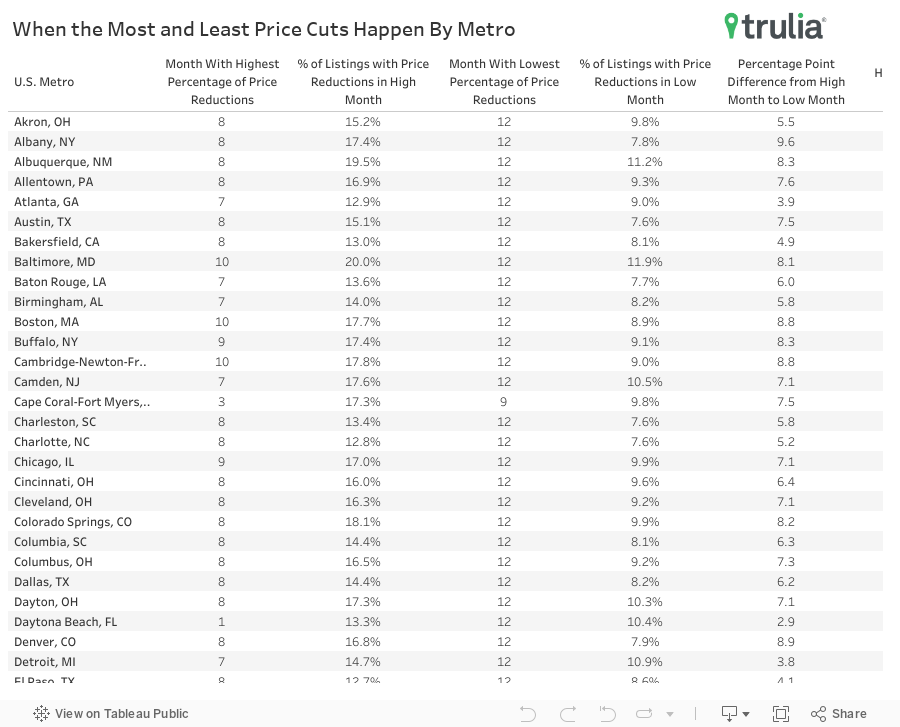
Looking at the seasonality of price cuts at a more local level, we notice a few interesting outliers. All but two of the 100 largest markets have their lowest proportion of price cuts in December. In Richmond, Va., the month with the fewest proportion of unique listings that go through at least one price cut has been falling in February and in Cape Coral-Fort Myers, Fla., it is in September. The month with the highest proportion of price reductions is much more variable though with 46 of the largest 100 markets seeing the most price reductions in August, followed by 19 in October and 16 in July.
How much the proportion swings between high and low price cut months has a lot to do with, well, the seasons. With a few exceptions, there is a high positive correlation between the severity of winter and how much price cuts swing between summer months and winter months. In all of the major Florida markets, the month with the highest rate if price cuts is 1.6 or fewer times greater than the month with the lowest rate of price cuts. Other cities with these low swings include Riverside, Calif., Tucson, Tacoma, Wash., and Las Vegas. Places that have the widest swing in price cut rates between high and low months included places like Fairfield County, CT, Albany, NY, and Madison, Wisc. where the rates of price cuts in August or September are at least 2.2 times as large as the rate in December.
Where Price Cuts Rule
Do More Price Cuts Mean a Cooling Market? Nope, Not Lately
The share of properties going through at least one price cut has been climbing on a year-over-year basis for eight of the past 12 months. During the same 12 months a year ago, the proportion of properties going through at least one price cut increased in seven of 12 months. On an annualized basis, this has brought the rate of price cuts to its highest level, 13.4%, since the housing market bottomed out in 2012. Since that time, the most consistent period of monthly year-over-year growth in the proportion of for-sale listings experiencing a price cut occurred between early 2013 and early 2015. This two-year period also coincides with the most rapid home price appreciation following the recession indicating that, at least since 2012, rather than being a sign of a slowing market, price cuts seem to show that sellers get overeager in hot markets and are then forced to dial back.
More locally, Phoenix, (19.1%), Lake County-Kenosha County, Ill.-Wis., (18.6%), and Chicago (18.2%) saw the highest share of listings go through at least one price cut during the past year. The three Bay Area Cities, San Francisco, San Jose, Calif., and Oakland, Calif., were the places with the smallest proportion of listings that saw a price cut at 6.3%, 7.3%, and 8.0%, respectively. Baton Rouge, La., takes the No. 1 spot for the metro with the largest increase in proportion of for-sale listings with price reductions from last year to the most recent 12-months, followed by New Orleans, at No. 2. These cities saw a 3.5, and 3.4 percentage-point increases respectively. Price growth in New Orleans (and Baton Rouge until recently) has been increasing at well above the national rate.
Looking back to 2012, when the housing market hit its trough and price cuts were much less common, the places that have seen the largest jump in the rate of price cuts are many of the places that saw the busts and subsequent booms in homes prices during the recession and beyond. These are places like Phoenix, Bakersfield, Calif., and many of the Florida markets.
Methodology
This report was developed using our For-Sale listing data. The report uses the entire price history of every listing found on Trulia’s website, dating back to Feb. 1, 2011 and up through Oct. 31, 2017. We calculated the total number of unique properties in each month and, the number of unique properties each month that saw at least one price reduction. This enabled us to calculate the percentage of listings that saw a price reduction. Metro areas found in this report are metropolitan divisions where available, but are otherwise metropolitan statistical areas, both as defined by the U.S. Census Bureau.

